Web Interface Components
The interface of NAKIVO Backup & Replication consists of the following components:
Main Menu
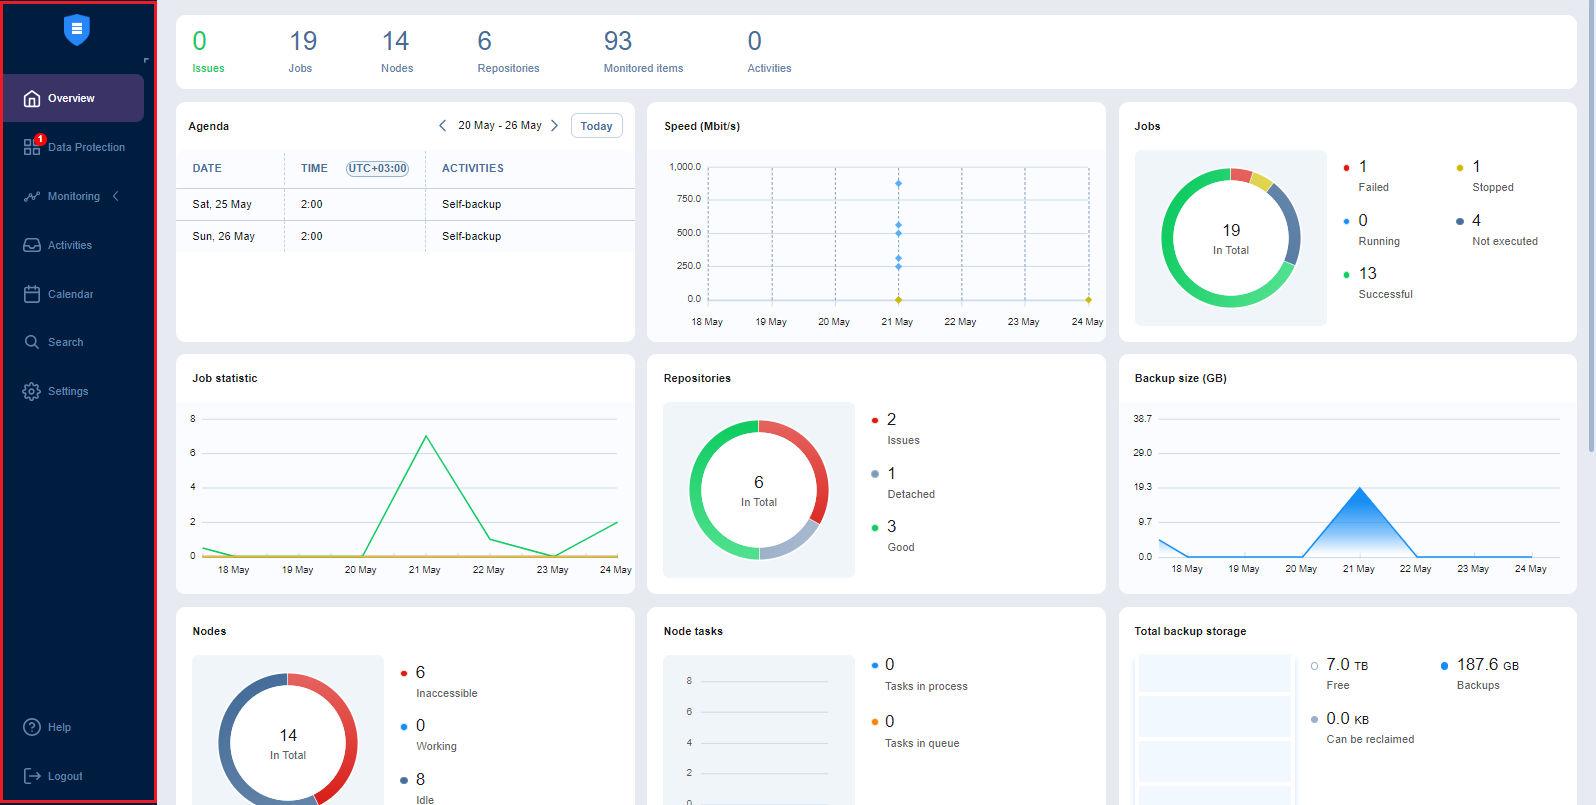
The main menu of NAKIVO Backup & Replication is located on the left side of the product interface. It provides access to the overview dashboard, jobs, activities, calendar, global search, and product settings. It also contains the Help menu and Log Out button.
Overview
The Overview page displays the key statistics for your instance of NAKIVO Backup & Replication. The information is displayed in the following widgets:
-
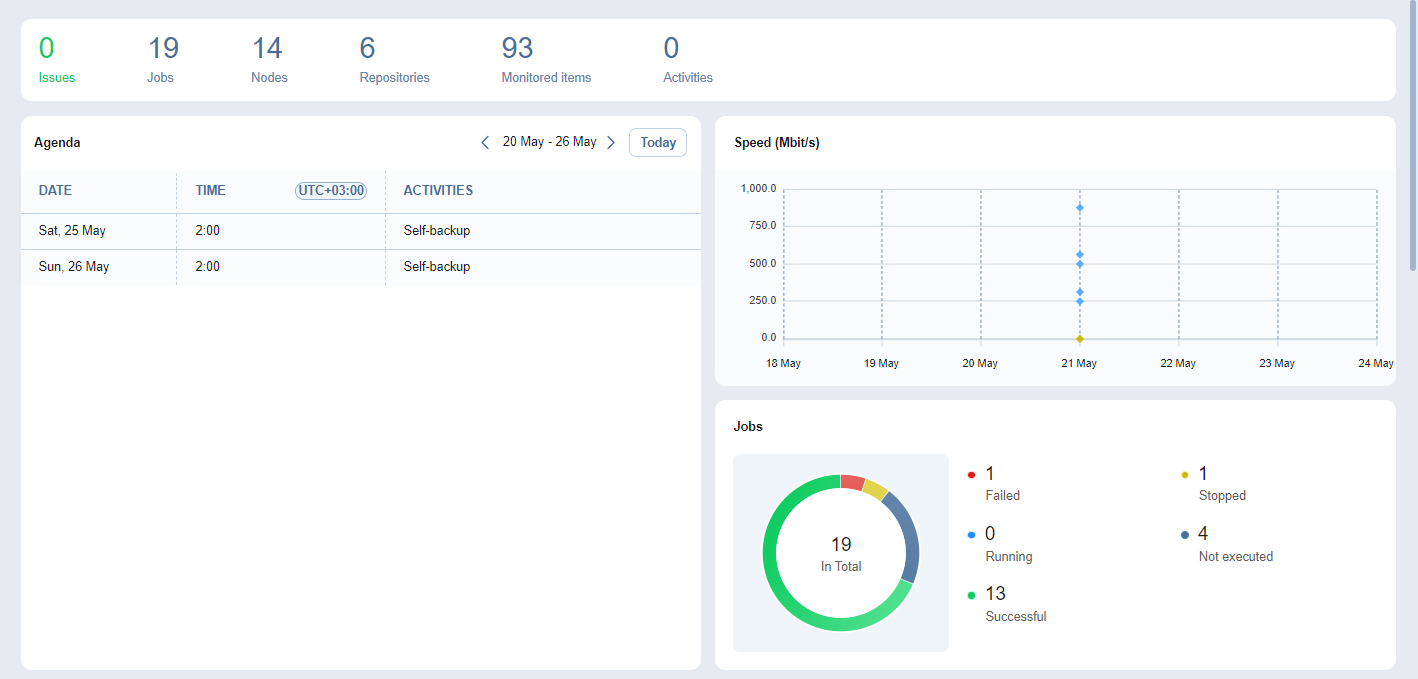
Summary bar: Lists the total number of issues (errors and alarms), jobs, transporters, repositories, monitored items, and running activities.
-
Agenda: Lists running and scheduled activities for a given week. By default, this widget displays the current week.
-
Speed: Displays the speed at which raw data has been transferred during successful job runs in the previous seven days.
-
Jobs: Displays the total number of available jobs and their respective last run statuses.

-
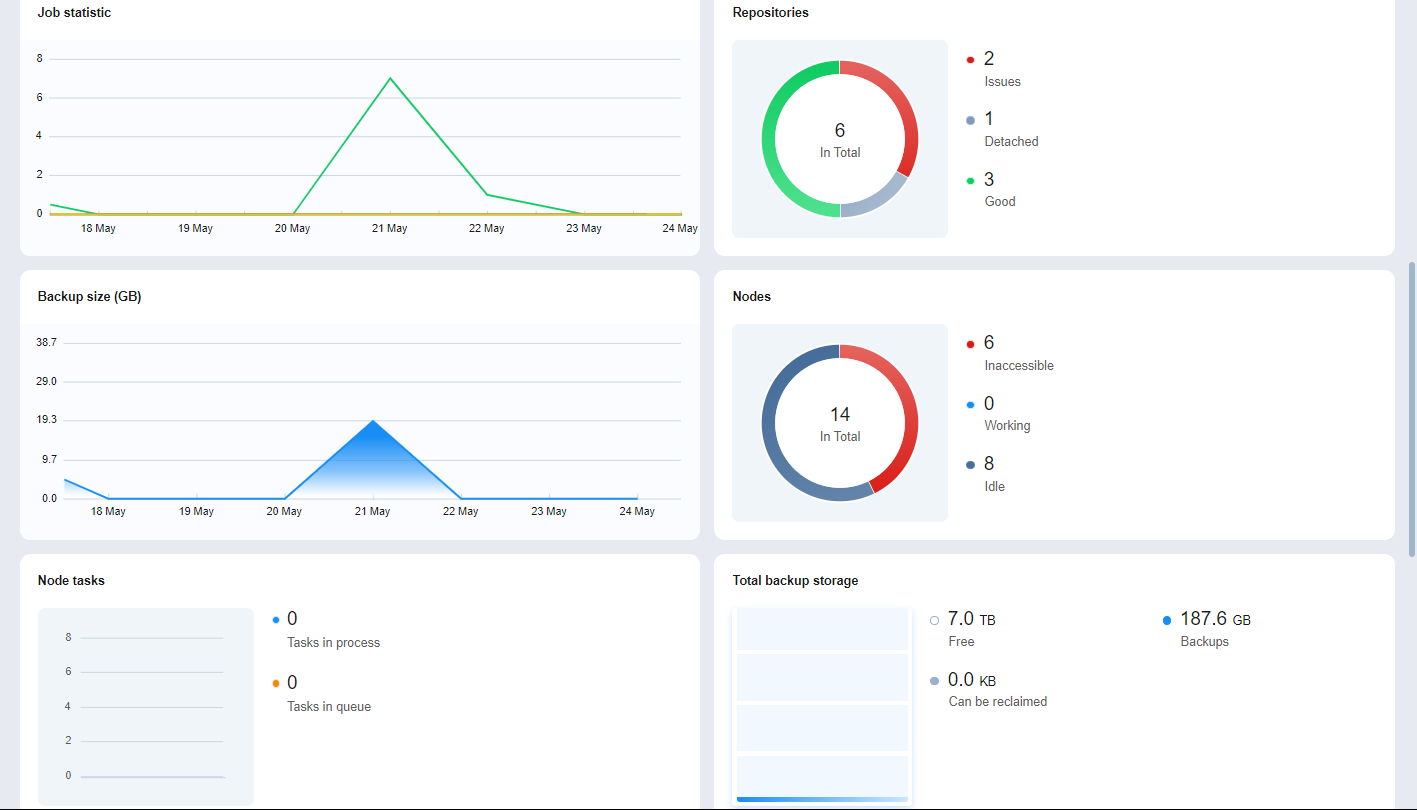
Job statistic: Shows a graph of the number of successful, stopped, and failed jobs for each day in the previous seven days.
-
Repositories: Displays the total number of available repositories and their statuses.
-
Backup size: Displays the total size of backups created for each day in the previous seven days. Note that backups in forever incremental (Store backups in separate files option is not selected) Backup Repositories are considered 0KB, and thus are not reflected in the Backup size graph.
-
Transporters: Displays the total number of available transporters that have been added or deployed successfully and their statuses.
-
Transporter tasks: Displays the total number of tasks being processed or waiting to be processed by all transporters.
-
Total backup storage: Displays the total amount of storage of all available repositories.

-
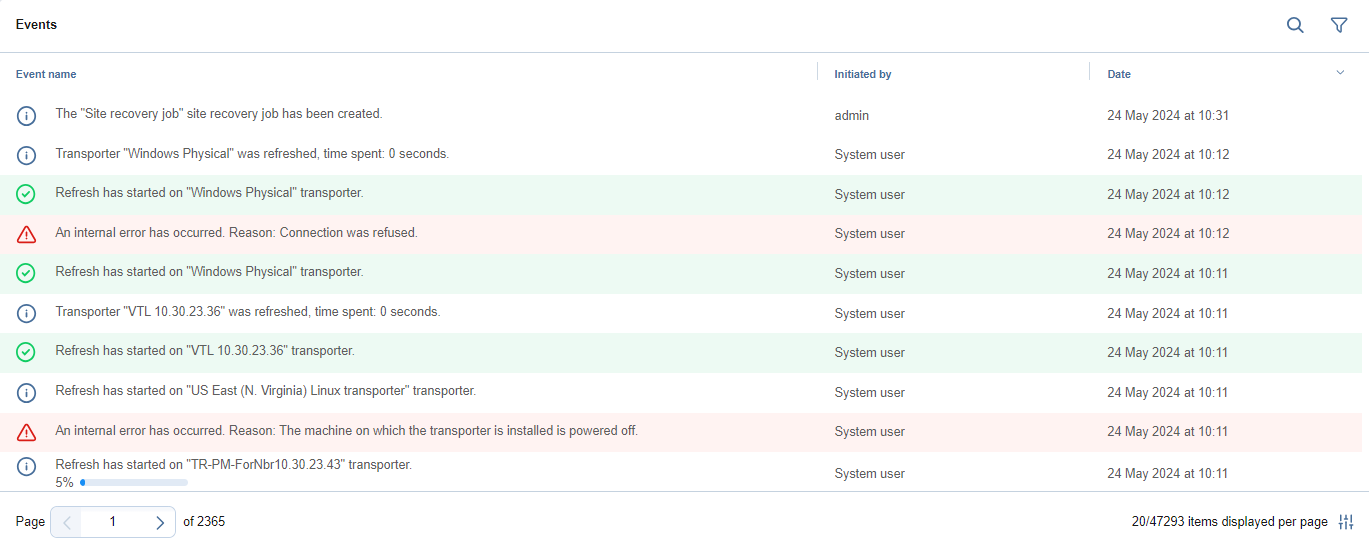
Events: Lists all events, including errors, warnings, and general status information, sorted by date by default. Includes search and filter functions that simplify finding specific events by name, type, or date range.

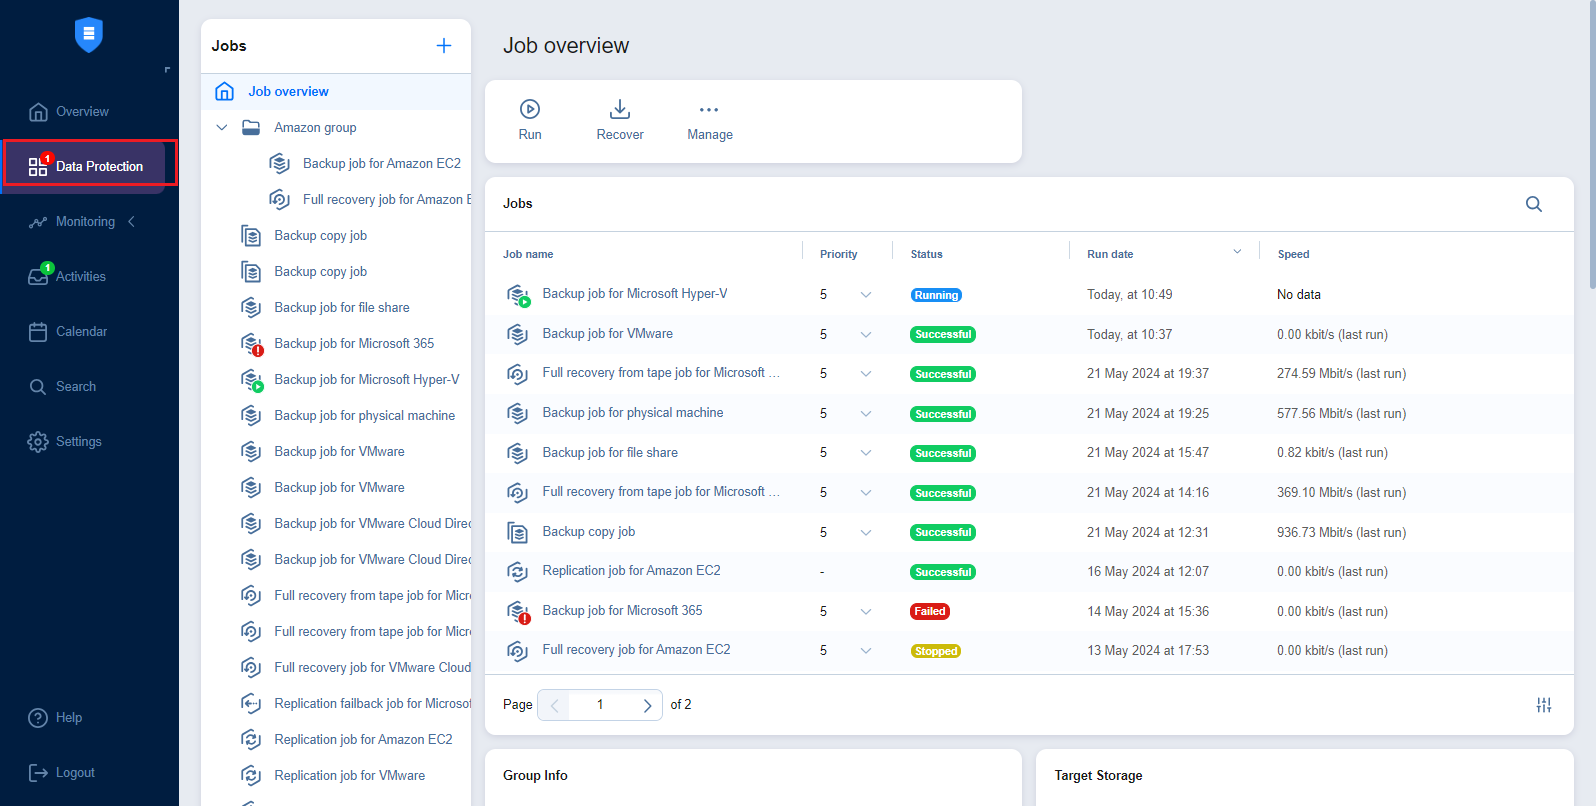
Data Protection
Using the Data Protection page, you can:
-
View, run, and stop jobs on demand or on schedule
-
Recover files, objects, VMs, and sites
-
Manage jobs
-
Create backup, backup copy, replication, recovery, and flash boot jobs
-
Create job reports
-
Create and manage job groups

Monitoring
On the Monitoring page, you can check the following metrics (current and historical):
-
For VMware VMs: CPU usage, memory usage, and disk usage
-
For VMware hosts: CPU usage and memory usage
-
For VMware datastores: Disk usage
For additional information, refer to the Monitoring topic.

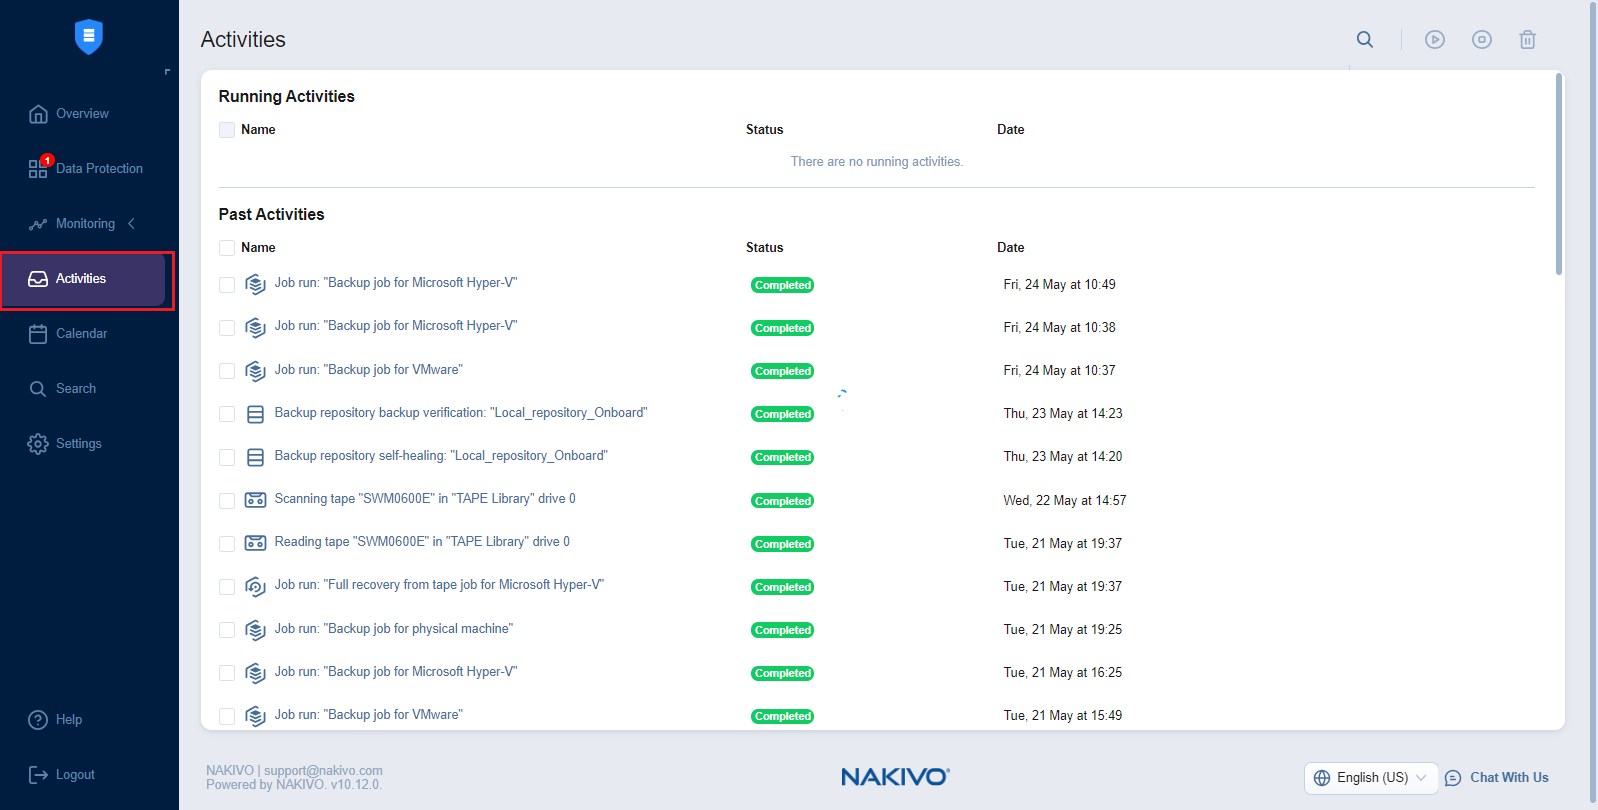
Activities
The Activities page displays a list of all running and past activities, such as:
-
Job run
- Repository Self-Backup
-
File download
-
Application object download
-
Universal object recovery
-
Repository space reclaim
-
Repository self-healing
-
Repository backup verification
-
- Other
For further details and information, refer to Managing Activities.
Calendar
The Calendar allows you to schedule jobs and view the history of all job runs in one organized space. For more information, refer to Using Calendar.

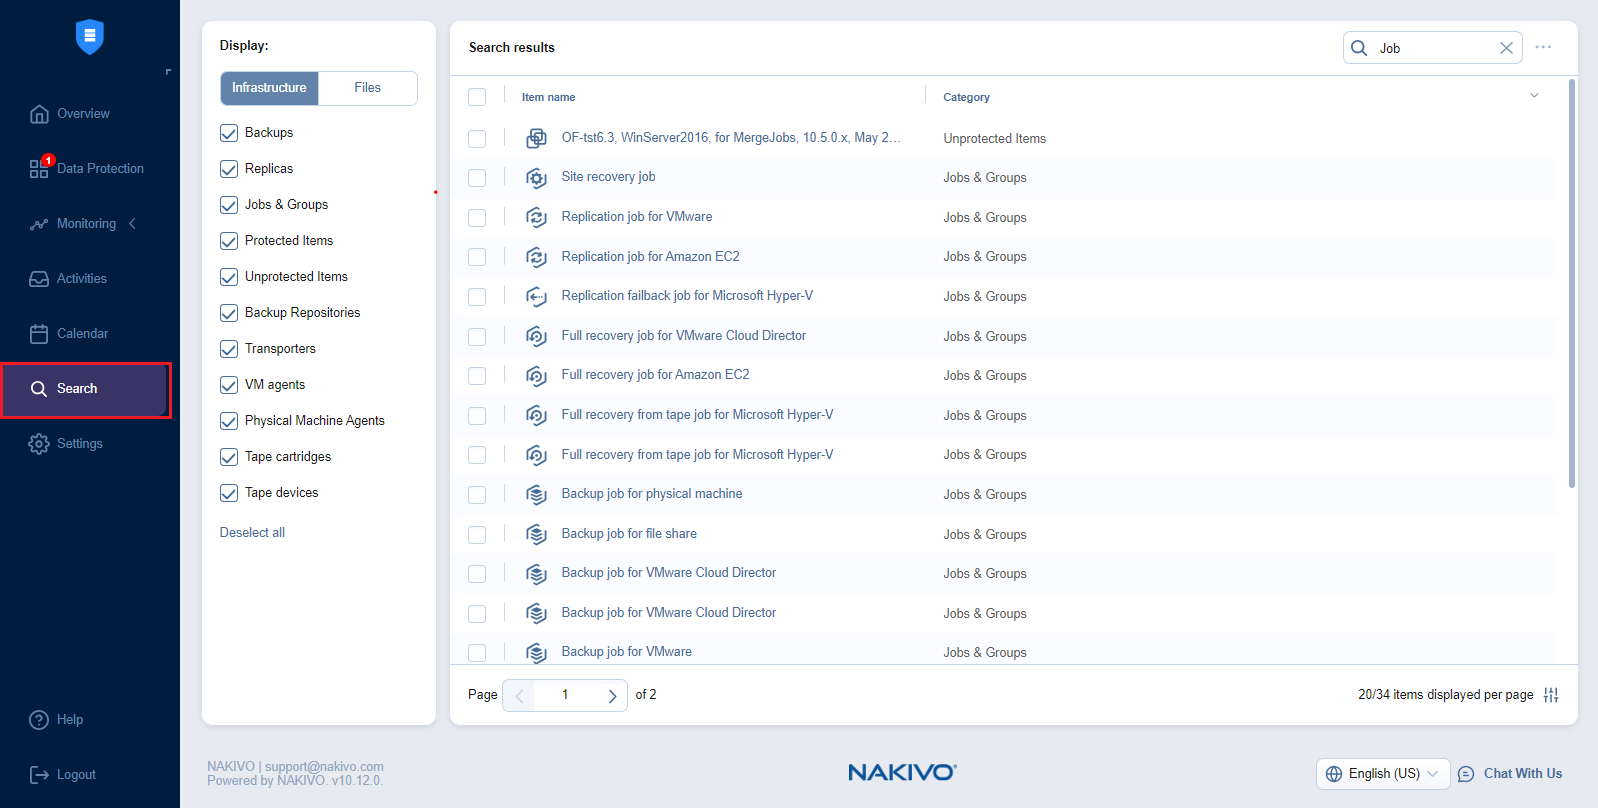
Search
The Search page allows you to search for items within the entire NAKIVO Backup & Replication instance–the Inventory, Transporters, Repositories, tape devices, jobs, backups, replicas, and more. For more details, refer to Using Global Search.
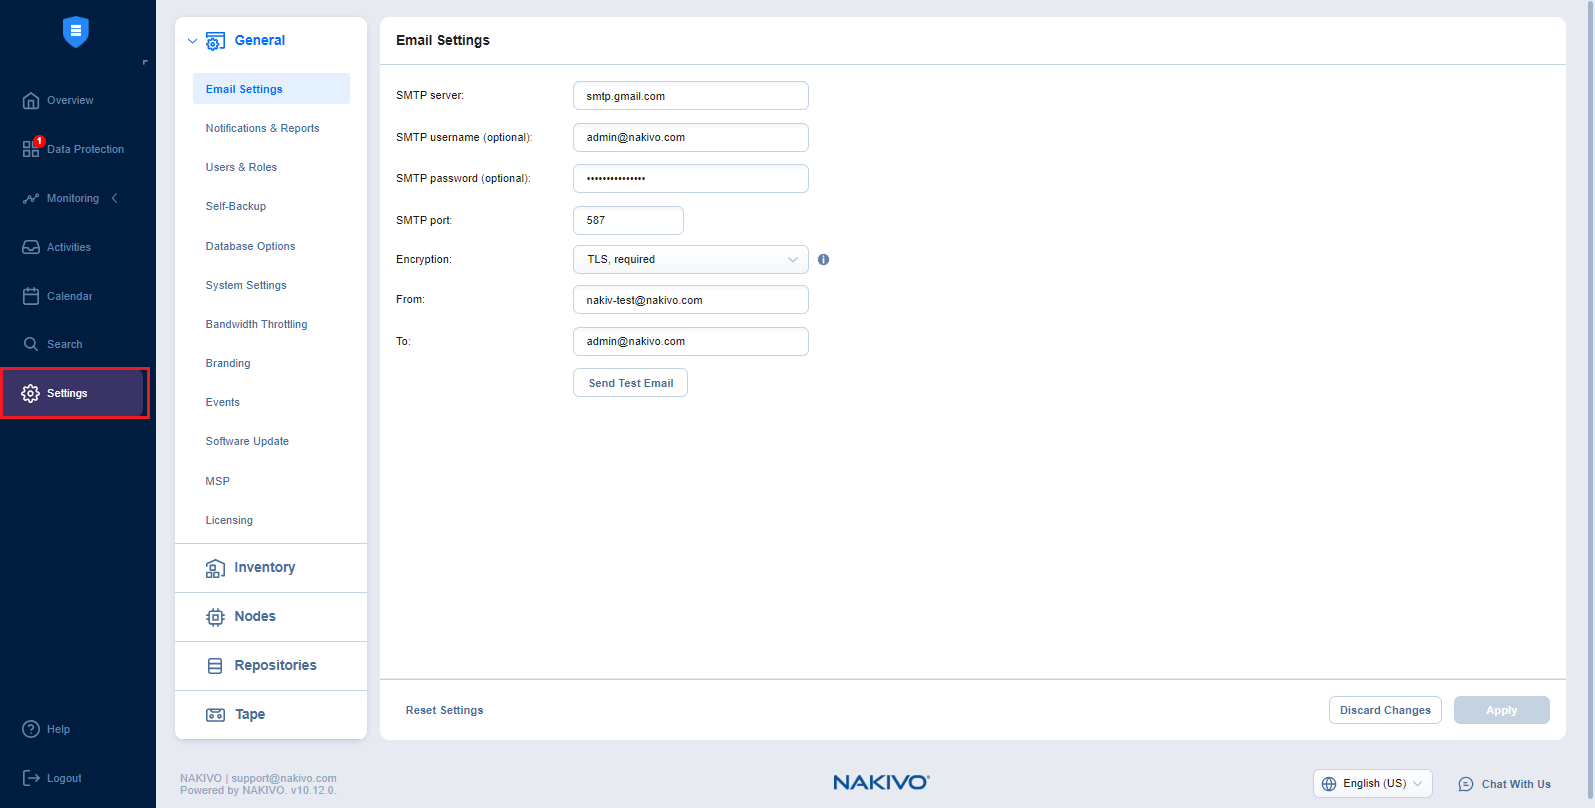
Settings
On the Settings page, you can configure NAKIVO Backup & Replication General, Inventory, Transporters, Repositories, and
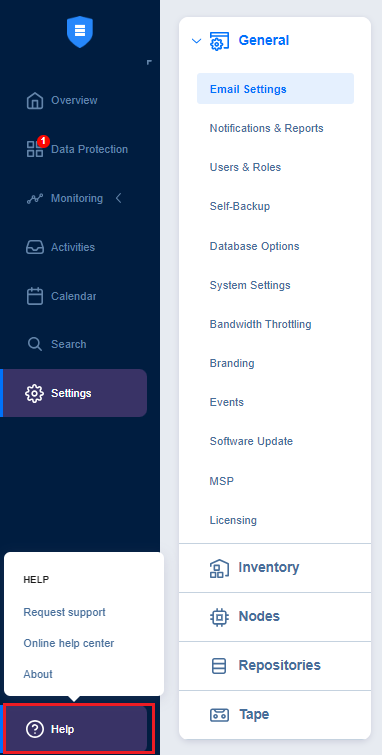
Help Menu
Use the Help menu to request technical support and access the NAKIVO online help center or see information about your product. If you are evaluating NAKIVO Backup & Replication, you may also check the the How to Buy section of the Help menu to view pricing, request a live demo or quote, find a reseller, or contact Sales. If you are using a Free license, you may also upgrade to a Trial license for 15 days with the Try full functionality option.
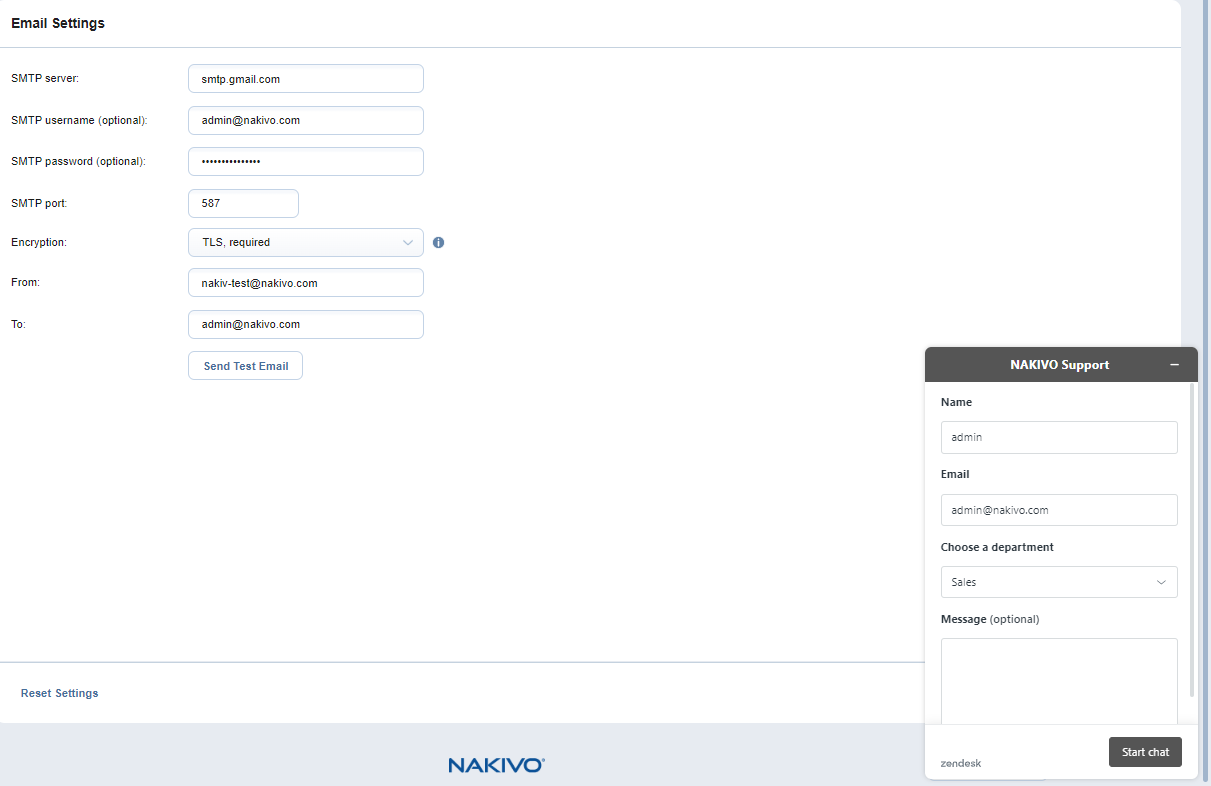
Online Chat Dialog
The NAKIVO Support online chat is located in the right bottom corner of the application. It enables you to quickly request help from a sales or technical support representative.
Language Selection
NAKIVO Backup & Replication supports the following languages:
- Spanish
-
French
-
German
-
Italian
-
Polish
-
Japanese
-
Chinese (simplified)
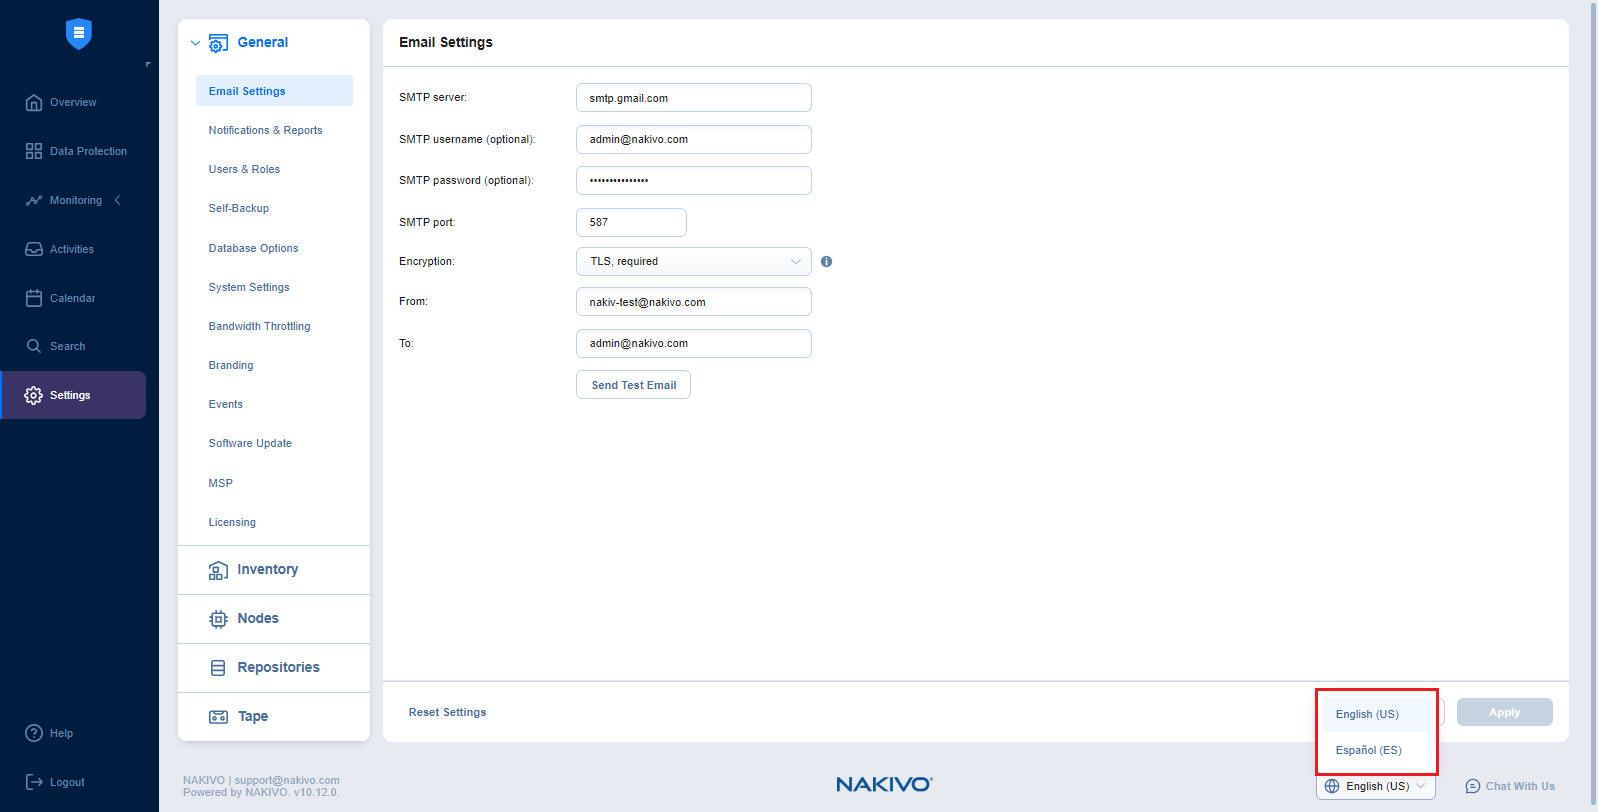
To select the language for your NAKIVO Backup & Replication instance UI, do the following:
-
Log in to your NAKIVO Backup & Replication instance.
-
In the lower right corner of the NAKIVO Backup & Replication interface, select the needed language from the dropdown menu.

-
The current page reloads automatically with the UI and content switched to the selected language.
Notes
The language switching menu is available to users with the Administrator role only; the language change is applied globally (across all users).
In Multi-tenant deployment, it is available at the Master Admin level only; the language change is applied globally (across all local tenants/users).
Only users with the Administrator role can change the language in a remote tenant.
You can also change language in the product installer UI, in silent installation interface, and using the command line interface
Special Offers Toolbar
This element of the interface is located to the left of the NAKIVO Backup & Replication dashboard. The toolbar contains special offers. If you click the button, a dialog opens displaying information about a specific offer. If needed, the Special Offers toolbar can be disabled. Refer to System Settings for details.
Tenants Dashboard
If you use NAKIVO Backup & Replication in a multi-tenant mode, the Tenants dashboard allows you to create, manage, and configure tenants.