Metrics
The Metrics dashboard displays the key indicators for monitored items. When you go to Monitoring, the Metrics dashboard is displayed by default. Refer to the following topics to learn how to use the Metrics dashboard:
Metrics Overview
In the left pane of the Metrics dashboard, you can find the following:
-
Search box: Enter the partial or full name of an item in the search box to find it in your inventory items.
-
Filter button: Click the button to filter the items displayed by type. You can filter the displayed items by:
-
Hosts
-
Datastores
-
VMs
-
-
Edit button: Manually select items from your Inventory to monitor or create a policy rule for items to be added automatically.
-
Overview: Monitored items are displayed in tree view when you expand Overview. Select a monitored item to view the corresponding metrics.
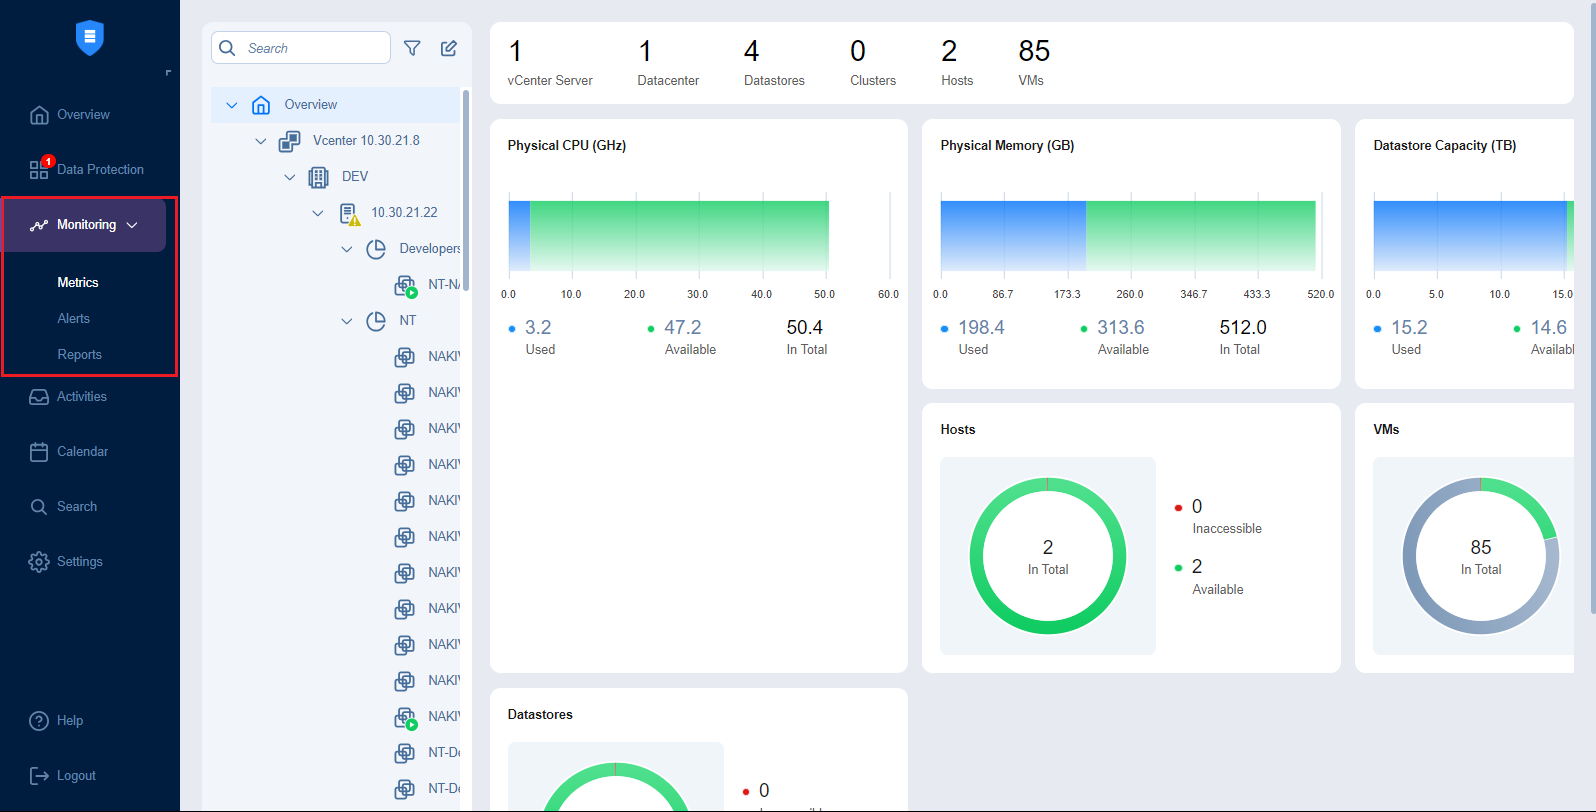
In the right pane of the Metrics dashboard, you can see the number of issues and the corresponding performance bar and line charts for the monitored item.
The following information is displayed for each type of selected item:
-
VMs
-
CPU Load: Shows the CPU load in percentage in real time.
-
Memory Load: Shows the memory usage in percentage in real time.
-
Disk Usage: Shows the disk usage in gigabytes in real time.
-
CPU Usage (%): Shows the CPU load in percentage over a specified period of time.
-
Memory Usage (GB): Shows the memory usage in gigabytes over a specified period of time.
-
Disk Usage (GB): Shows the disk usage in gigabytes over a specified period of time.
-
-
Hosts
-
CPU Load: Shows the CPU load in percentage in real time.
-
Memory Load: Shows the memory usage in gigabytes in real time.
-
CPU Usage (%): Shows the CPU load in percentage over a specified period of time.
-
Memory Usage (GB): Shows the memory usage in gigabytes over a specified period of time.
-
-
Datastores
-
Disk Usage: Shows the disk usage in terabytes in real time.
-
Disk Usage (TB): Shows the disk usage in terabytes over a specified period of time.
-
Managing Monitored Items
In this section, you can find out how to manage the items monitored in NAKIVO Backup & Replication, add items to the monitoring dashboard, specify time frames for charts, and understand data collection and data aggregation.
Adding Items to Monitoring Dashboard
The items added to the Monitoring dashboard depend on the NAKIVO Backup & Replication license.
Note
To use Monitoring, the following conditions must be met:
You must have a license for Monitoring. When using a non-trial license, you can add supported Inventory items to be monitored and edit those items manually.
Items of the supported platform must be added to the Inventory.
If a Free Trial license is installed, the product automatically adds top-level VMware vSphere containers from the Inventory to the list of monitored items when an Inventory item is initially discovered.
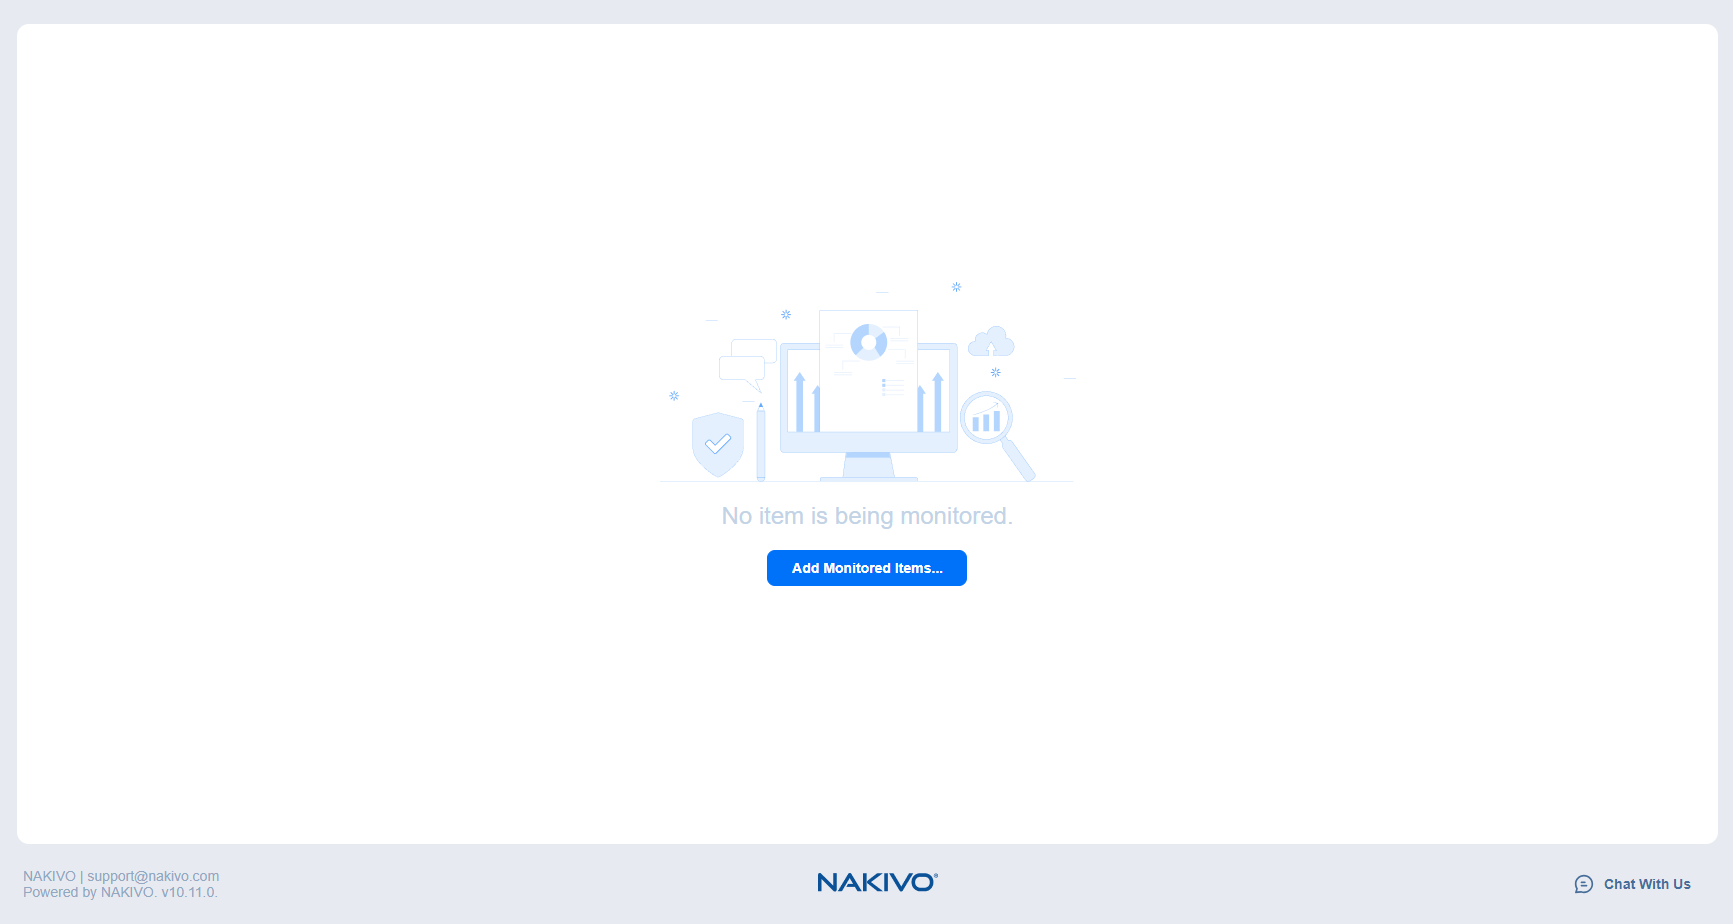
When first accessing the dashboard, you see the No item is being monitored message.
-
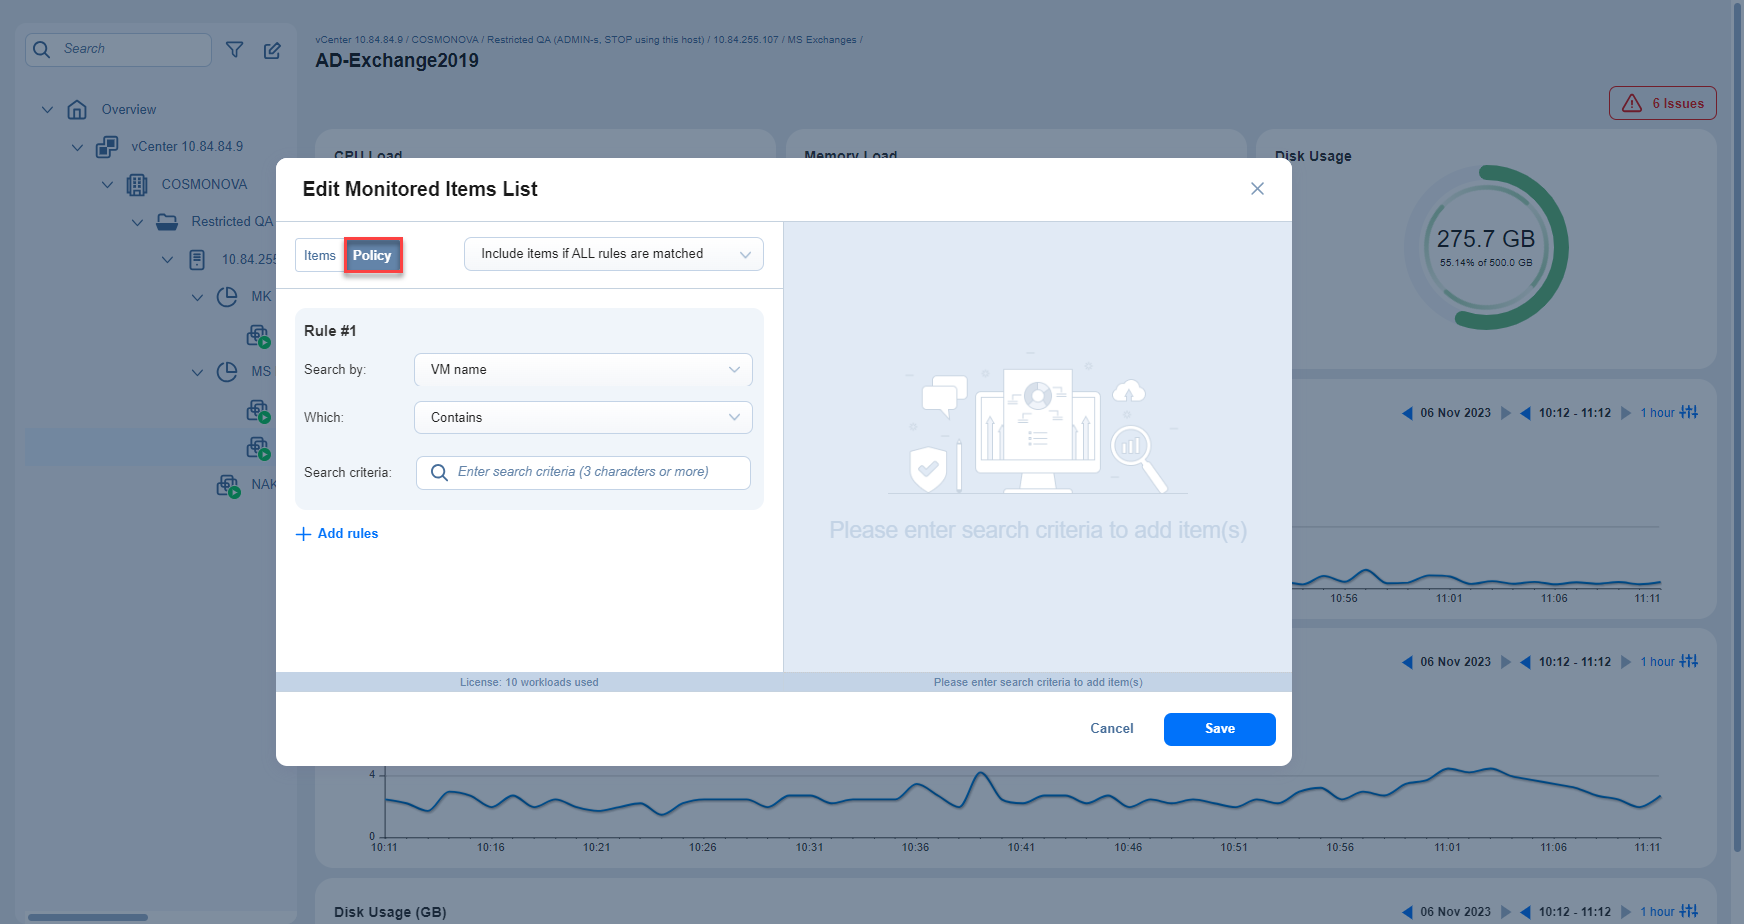
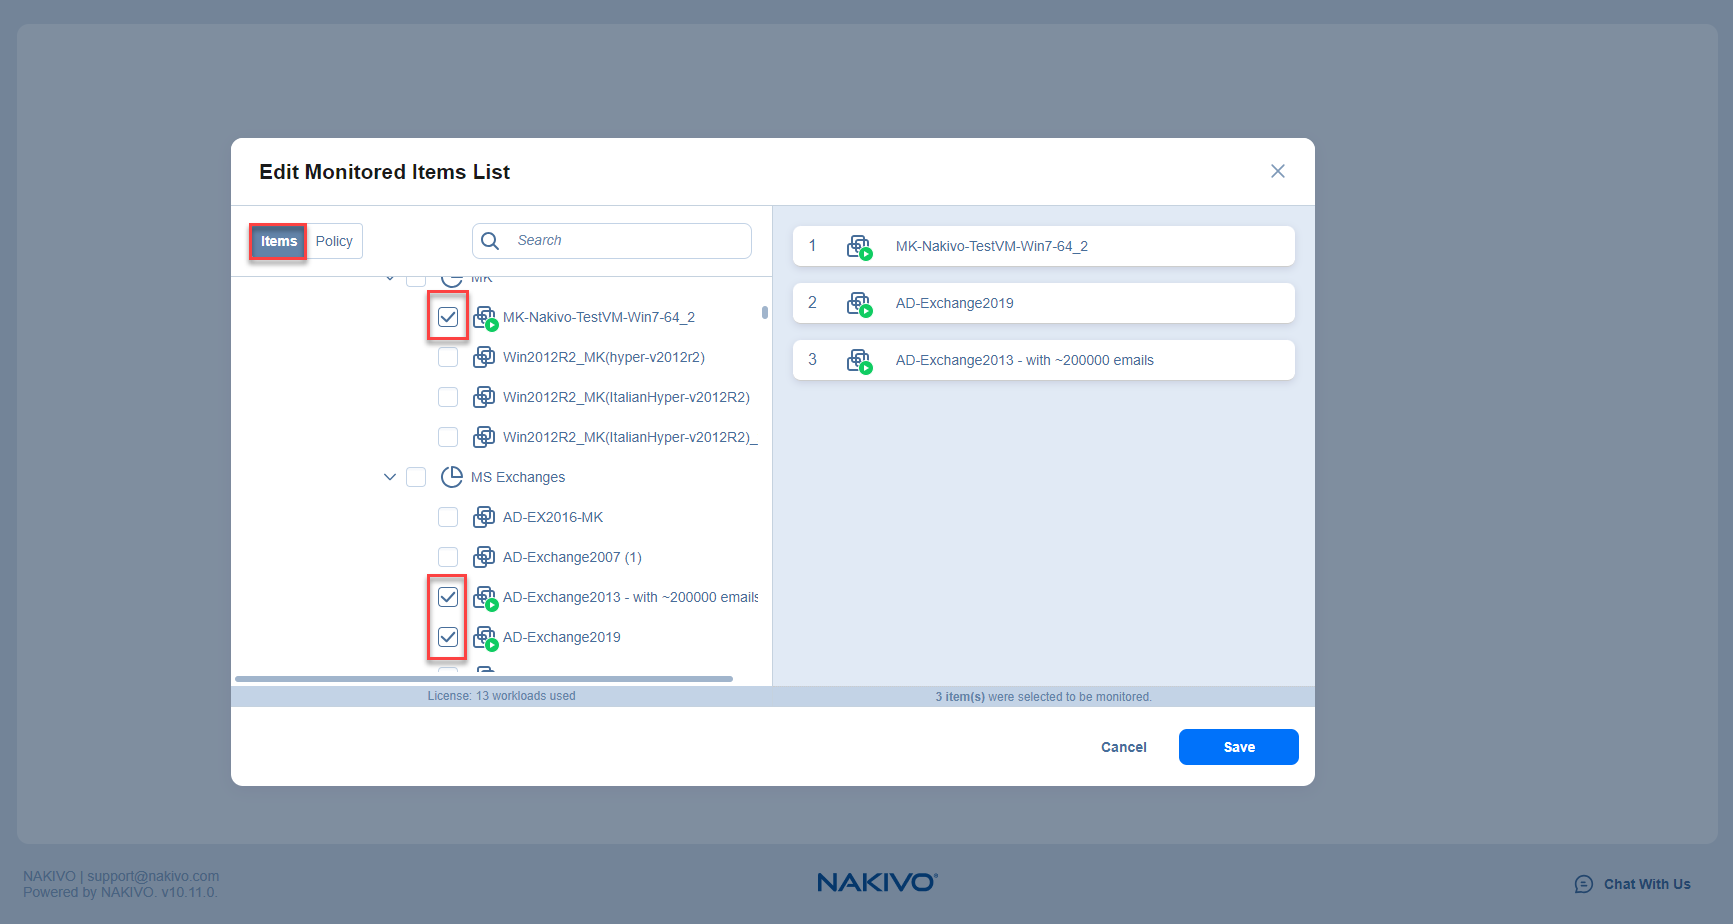
Click Add Monitored Items... to open the Edit Monitored Items List dialog window:

-
On the left side, choose the items you want to add for monitoring. Alternatively, you can set up policy rules to automatically add inventory items for monitoring.
-
Click Save when you are done.


Setting Up Chart Time Frames
You can specify time frames for the displayed historical CPU, memory, and disk usage line charts. To do so, click on the controls icon on the right for the needed chart and choose one of the following options:
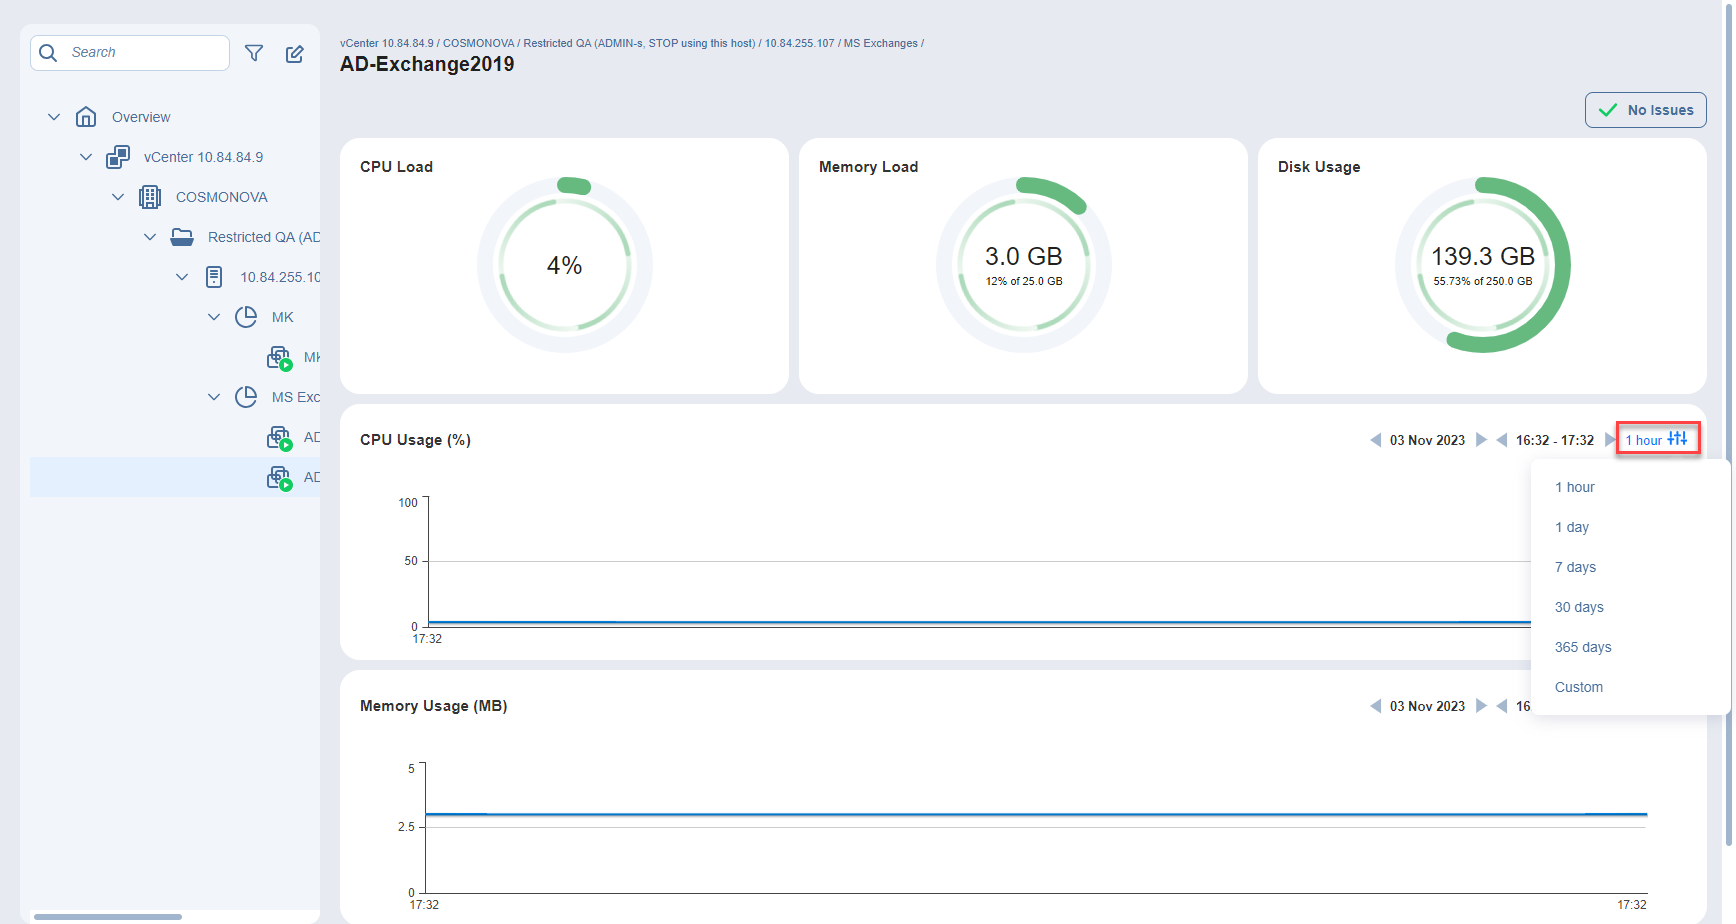
1 hour – to display data for a 1-hour time frame. The hour can then be specified.
1 day – to display data for a 1-day time frame. The day can then be specified.
7 days – to display data for a 7-day time frame. The 7-day period can then be specified.
30 days – to display data for a 30-day time frame. The 30-day period can then be specified.
365 days – to display data for a 365-day time frame. The 365-day period can then be specified.
Custom – when you select this option, the Calendar popup opens, and you can specify a custom time range for the chart. Click Apply when you are done.
Data Collection
NAKIVO Backup & Replication collects and updates data about monitored items every minute.
For VM CPU load, VM memory load, host CPU load, and host memory load, the following exceptions apply:
-
If the product cannot collect data every 1 minute for 5 minutes, data collection switches to a 5-minute interval. This mode collects 5 data points at once.
-
If the product cannot collect data every 5 minutes for 10 minutes, data collection switches to a 10-minute interval. This mode collects 10 data points at once.
For VM disk usage, VM memory usage, and datastore disk usage, if the product cannot collect data every 1 minute for 5 minutes, multiple real-time data points are collected but only the latest single data point within the 5-minute interval is retained and displayed.
Note
It may take up to 3-5 minutes for the widgets of the Overview tab to finish collecting data and display the latest information.
Data Aggregation
NAKIVO Backup & Replication creates a data point every minute. As the archive grows, the data points are aggregated as follows:
-
1-minute data points are aggregated into 10-minute data points every 10 minutes and calculated as the average value of all 1-minute points. 1-minute data points that are older than 1 day are automatically removed.
-
10-minute data points are aggregated into 1-hour data points and calculated as the average value of all 10-minute points. 10-minute data points that are older than 1 week are automatically removed.
-
After a year, 1-hour data points are removed.