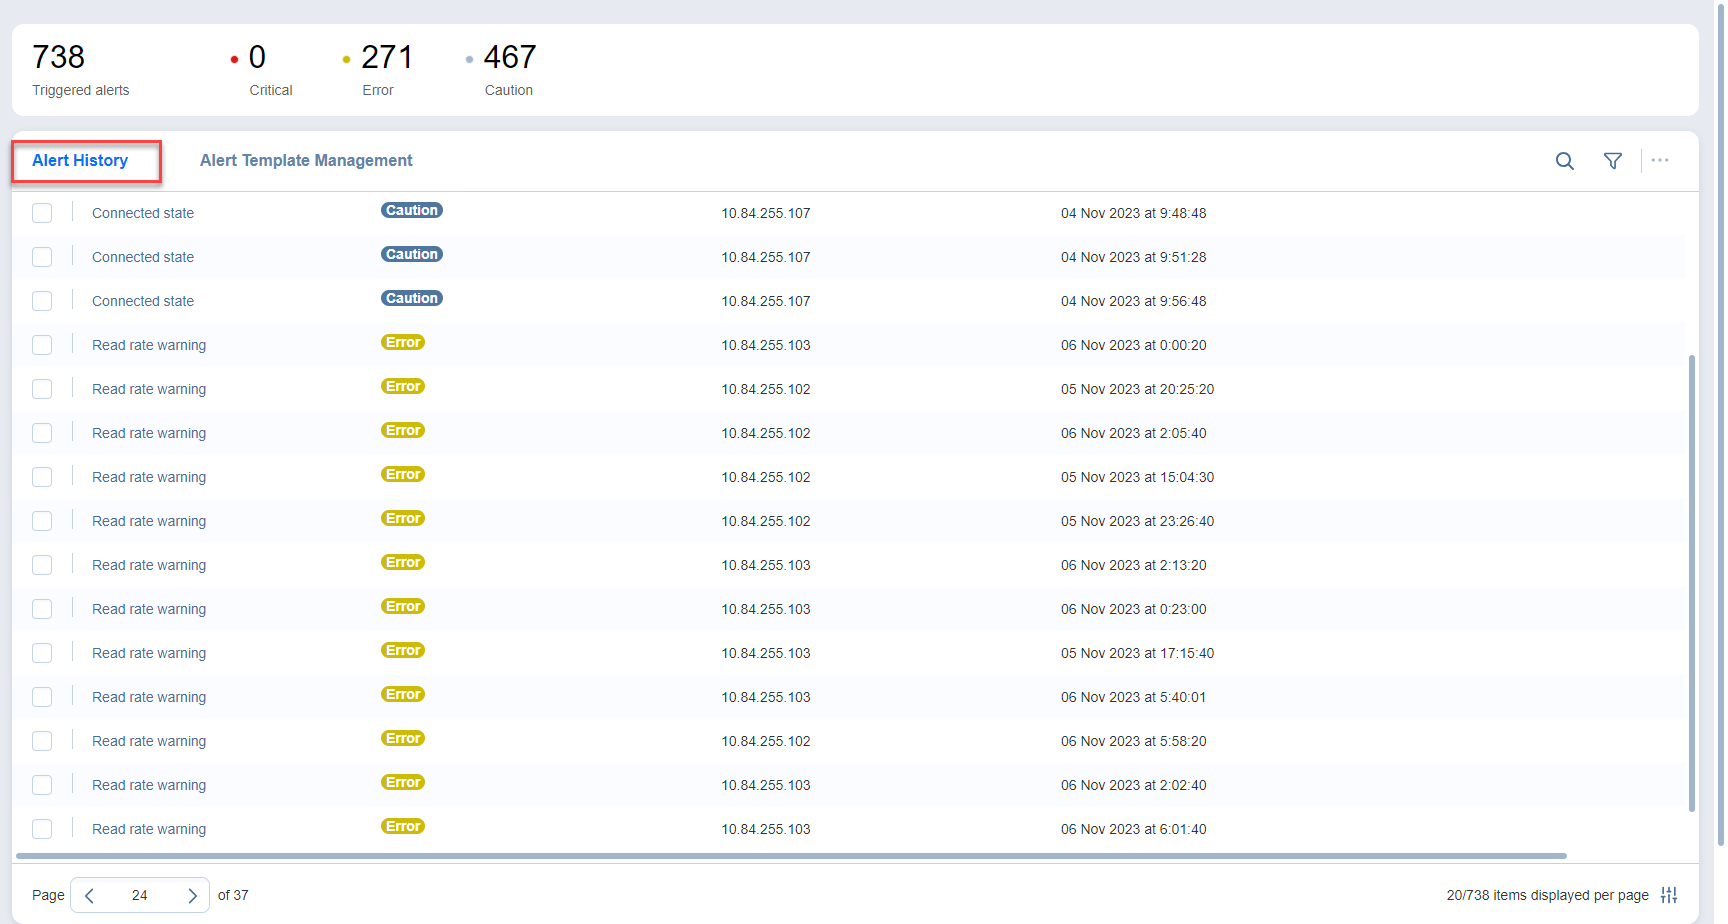
Alert History
The Alert History tab displays the list of triggered alerts. When the rules are met in an enabled alert template, the configured alert is triggered and displayed in the list.
In the Alert History tab, you can do the following:
-
View Alert History: View the triggered alerts displayed in the alert history table.
-
Search alerts by entering the partial or full name of an alert, source, or description.
-
Filter the alerts by Severity (Critical, Error, Caution) or Triggered Time.
-
Dismiss alerts by selecting an alert, clicking the ... (ellipsis) button, and then selecting Dismiss in the dialog window.
-
View alert settings by right-clicking the triggered alert to open the dialog window and selecting View Settings.
The Alert History table displays all triggered alerts with the following columns:
-
Alert name: The name of the alert.
-
Severity: The severity of the alert, which can be Caution, Error, or Critical.
-
Source: The host, VM, or datastore that the alert was triggered for.
-
Triggered time: The date and time when the alert was triggered.
-
Description: The description of the alert as defined in the alert template. For details, refer to Creating Alert Templates.
To customize the sorting of the table, click the head of the column you wish to sort by.
Note
The Alert History table can display up to 1,000 triggered alert records. After reaching this limit, the oldest alert is replaced automatically with the latest alert.