Navigating the Monitoring Dashboard
On the left side of the page, you can find the following:
-
Search bar: Enter the partial or full name of an item to search for it among your inventory items.
-
Filter: Click the button to filter the type of items you want to be displayed. These include the following:
-
Hosts
-
Datastores
-
VMs
-
-
Edit: Manually select the items you want to be monitored among your inventory or add them according to a specific policy.
-
Inventory tree: Your monitored items are displayed here. Click on any monitored item of a supported type to view its information.
On the right side of the Monitoring dashboard, you can find the notification bar and the relevant performance charts for the monitored inventory items. The displayed information is as follows:
-
VMs
-
CPU Load: Displays the CPU load of the selected monitored item in percentage at the current time.
-
Memory Load: Displays the memory usage of the selected monitored item in percentage at the current time.
-
Disk Usage: Displays the disk usage of the selected monitored item in gigabytes at the current time.
-
CPU Usage (%): Displays the CPU load of the selected monitored item in percentage over a specified period of time.
-
Memory Usage (GB): Displays the memory usage of the selected monitored item in gigabytes over a specified period of time.
-
Disk Usage (GB): Displays the disk usage of the selected monitored item in gigabytes over a specified period of time.
-
-
Hosts
-
CPU Load: Displays the CPU load of the selected monitored item in percentage at the current time.
-
Memory Load: Displays the memory usage of the selected monitored item in gigabytes at the current time.
-
CPU Usage (%): Displays the CPU load of the selected monitored item in percentage over a specified period of time.
-
Memory Usage (GB): Displays the memory usage of the selected monitored item in gigabytes over a specified period of time.
-
-
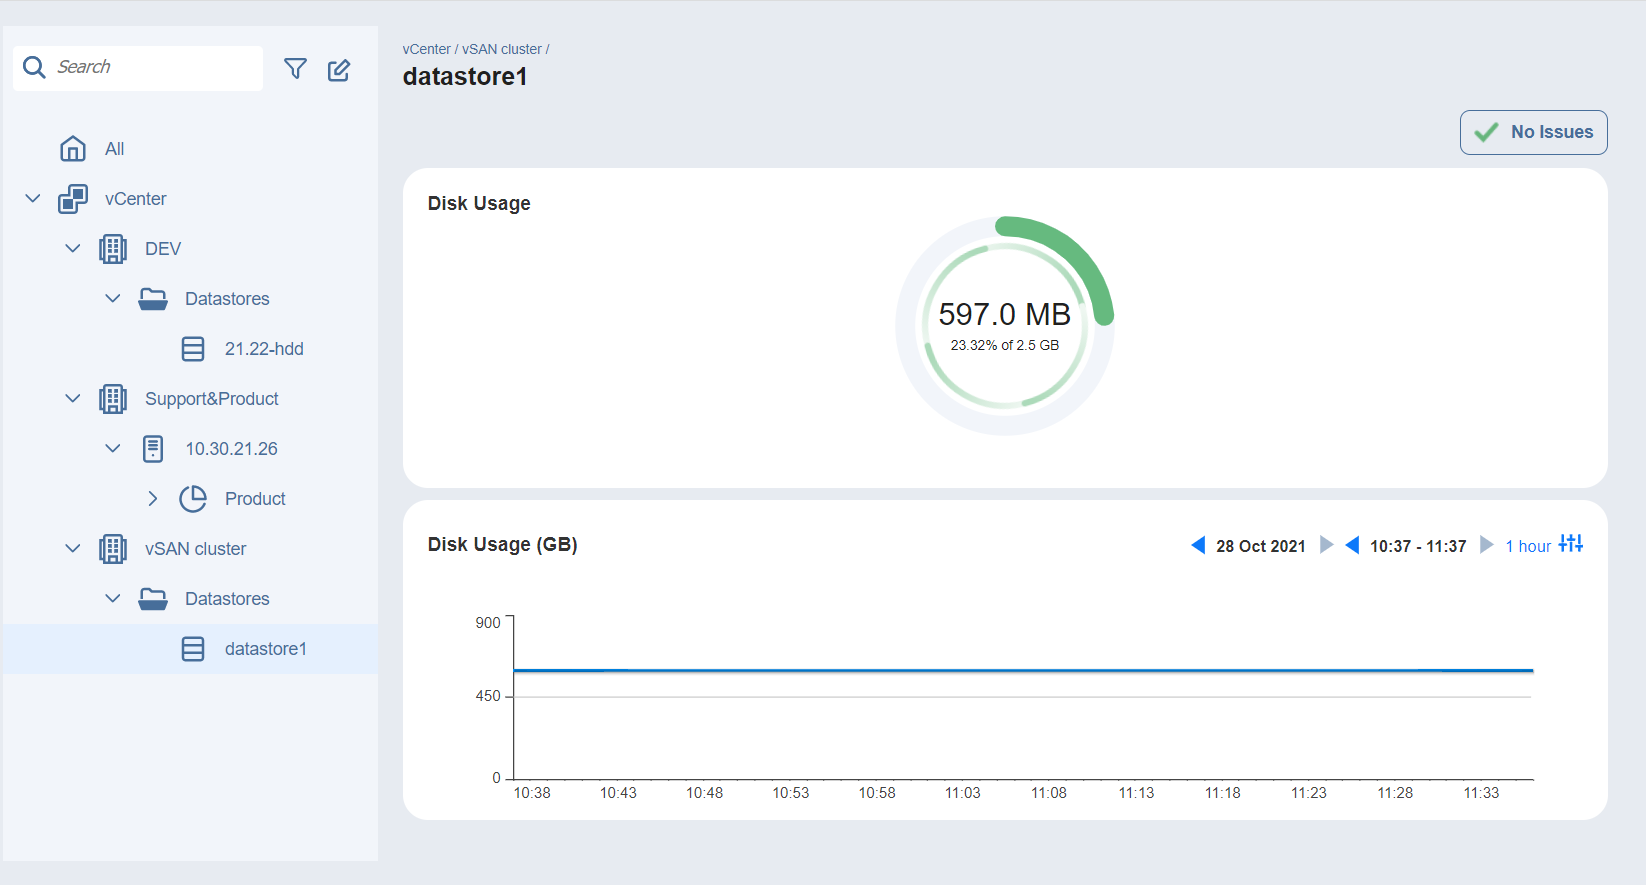
Datastores
-
Disk Usage: Displays the disk usage of the selected monitored item in gigabytes at the current time.
-
Disk Usage (GB): Displays the disk usage of the selected monitored item in gigabytes over a specified period of time.
-