Reports
The Reports dashboard allows you to add and view different types of reports about the monitored items in your VMware vSphere infrastructure. You can group reports, export reports to PDF or CSV format, as well as edit and delete them.
Refer to the following topics to learn how to use the Reports feature:
Reports Overview
The Reports dashboard displays all reports that have been added.
The left pane of the Reports dashboard includes the following options:
-
Search button: Click the button and enter the partial or full name of a report/group in the search bar to find it.
-
+ (add) button: Click to add a new report or create a report group. For details, refer to Creating Reports.
-
Overview list: Displays all the added reports and/or report groups. Select a report to display its details in the right panel. Right-click a report to open the dialog window with the following options: EDIT, RENAME, EXPORT, and DELETE.

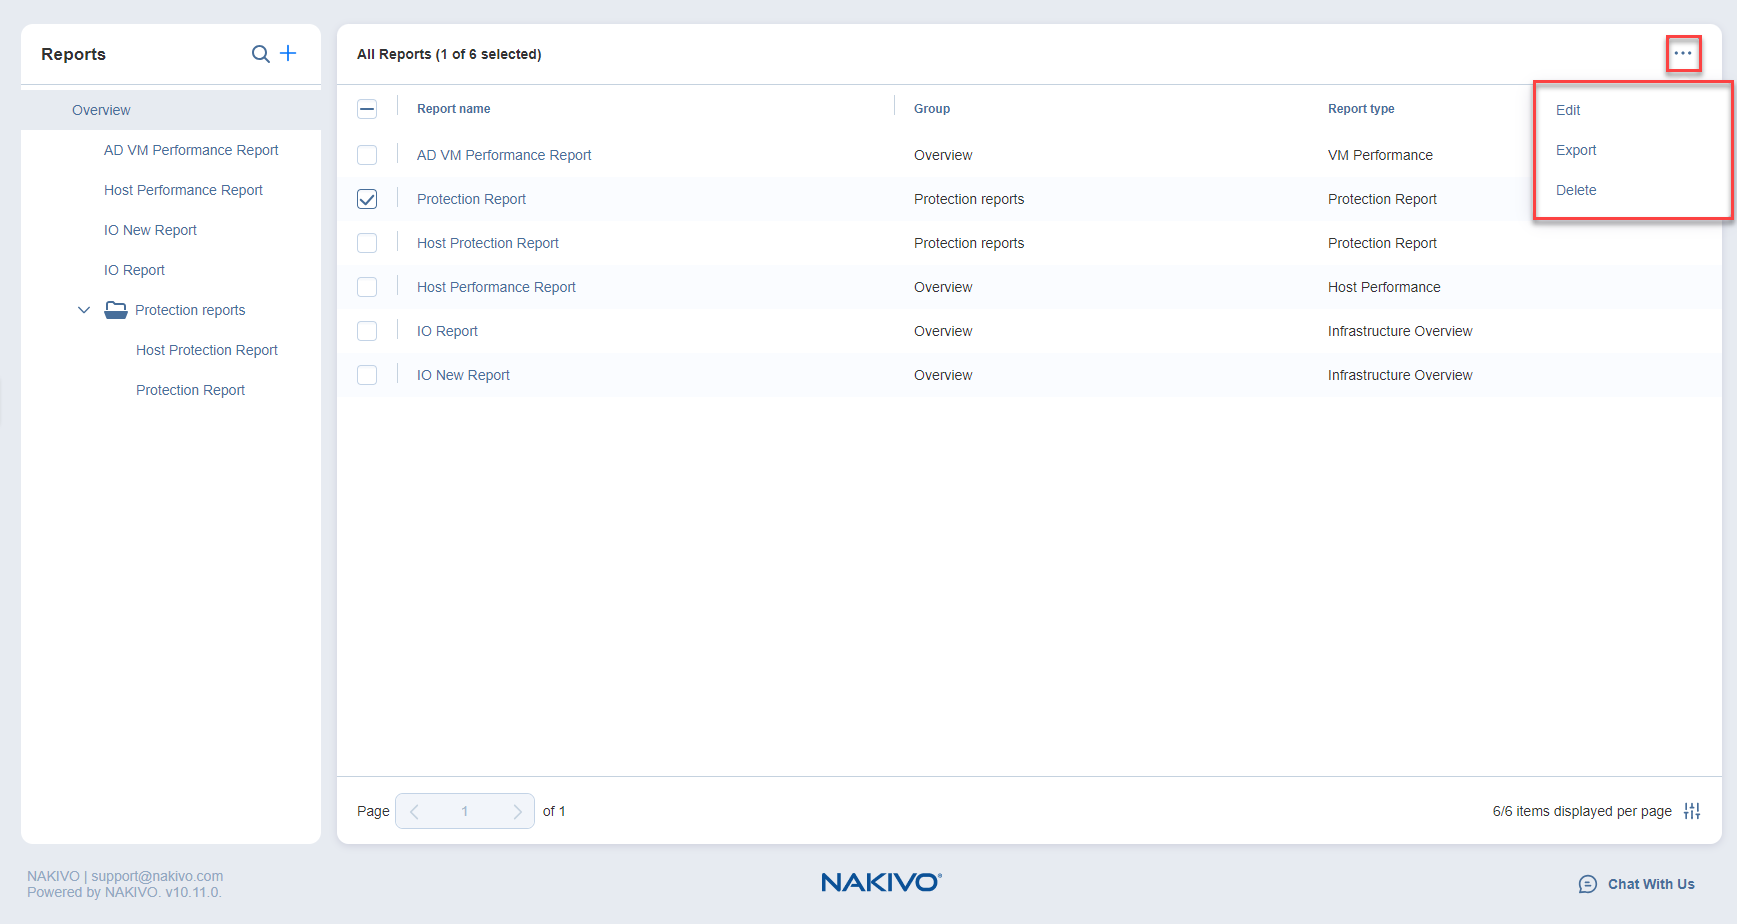
In the right pane of the Reports dashboard, the All Reports table is displayed with the following options:
-
... (ellipsis) button in the top right corner:
-
Edit: Select a report and click Edit to open the Edit Report wizard.
-
Export: Select a report and click Export to export it in PDF or CSV format.
-
Delete: Select a report and click Delete to remove it from the All Reports table.
-
-
Checkbox: Select a report to edit, download, or delete reports as described above.
-
Report name: Name of the configured report.
-
Group: Displays the name of the group the report belongs to. If a report is not part of a specific group, Overview is displayed.
-
Report type: Displays the report type selected in the Add New Report wizard. For details, refer to Report Types and Creating Reports.

Note
The Reports dashboard can display up to 100 created reports. When this limit is reached, the + (add) button will be disabled.
Report Types
The following report types are available:
Note
The report content will vary depending on the report type and configurations defined in the Add New Report wizard or Edit Report wizard.
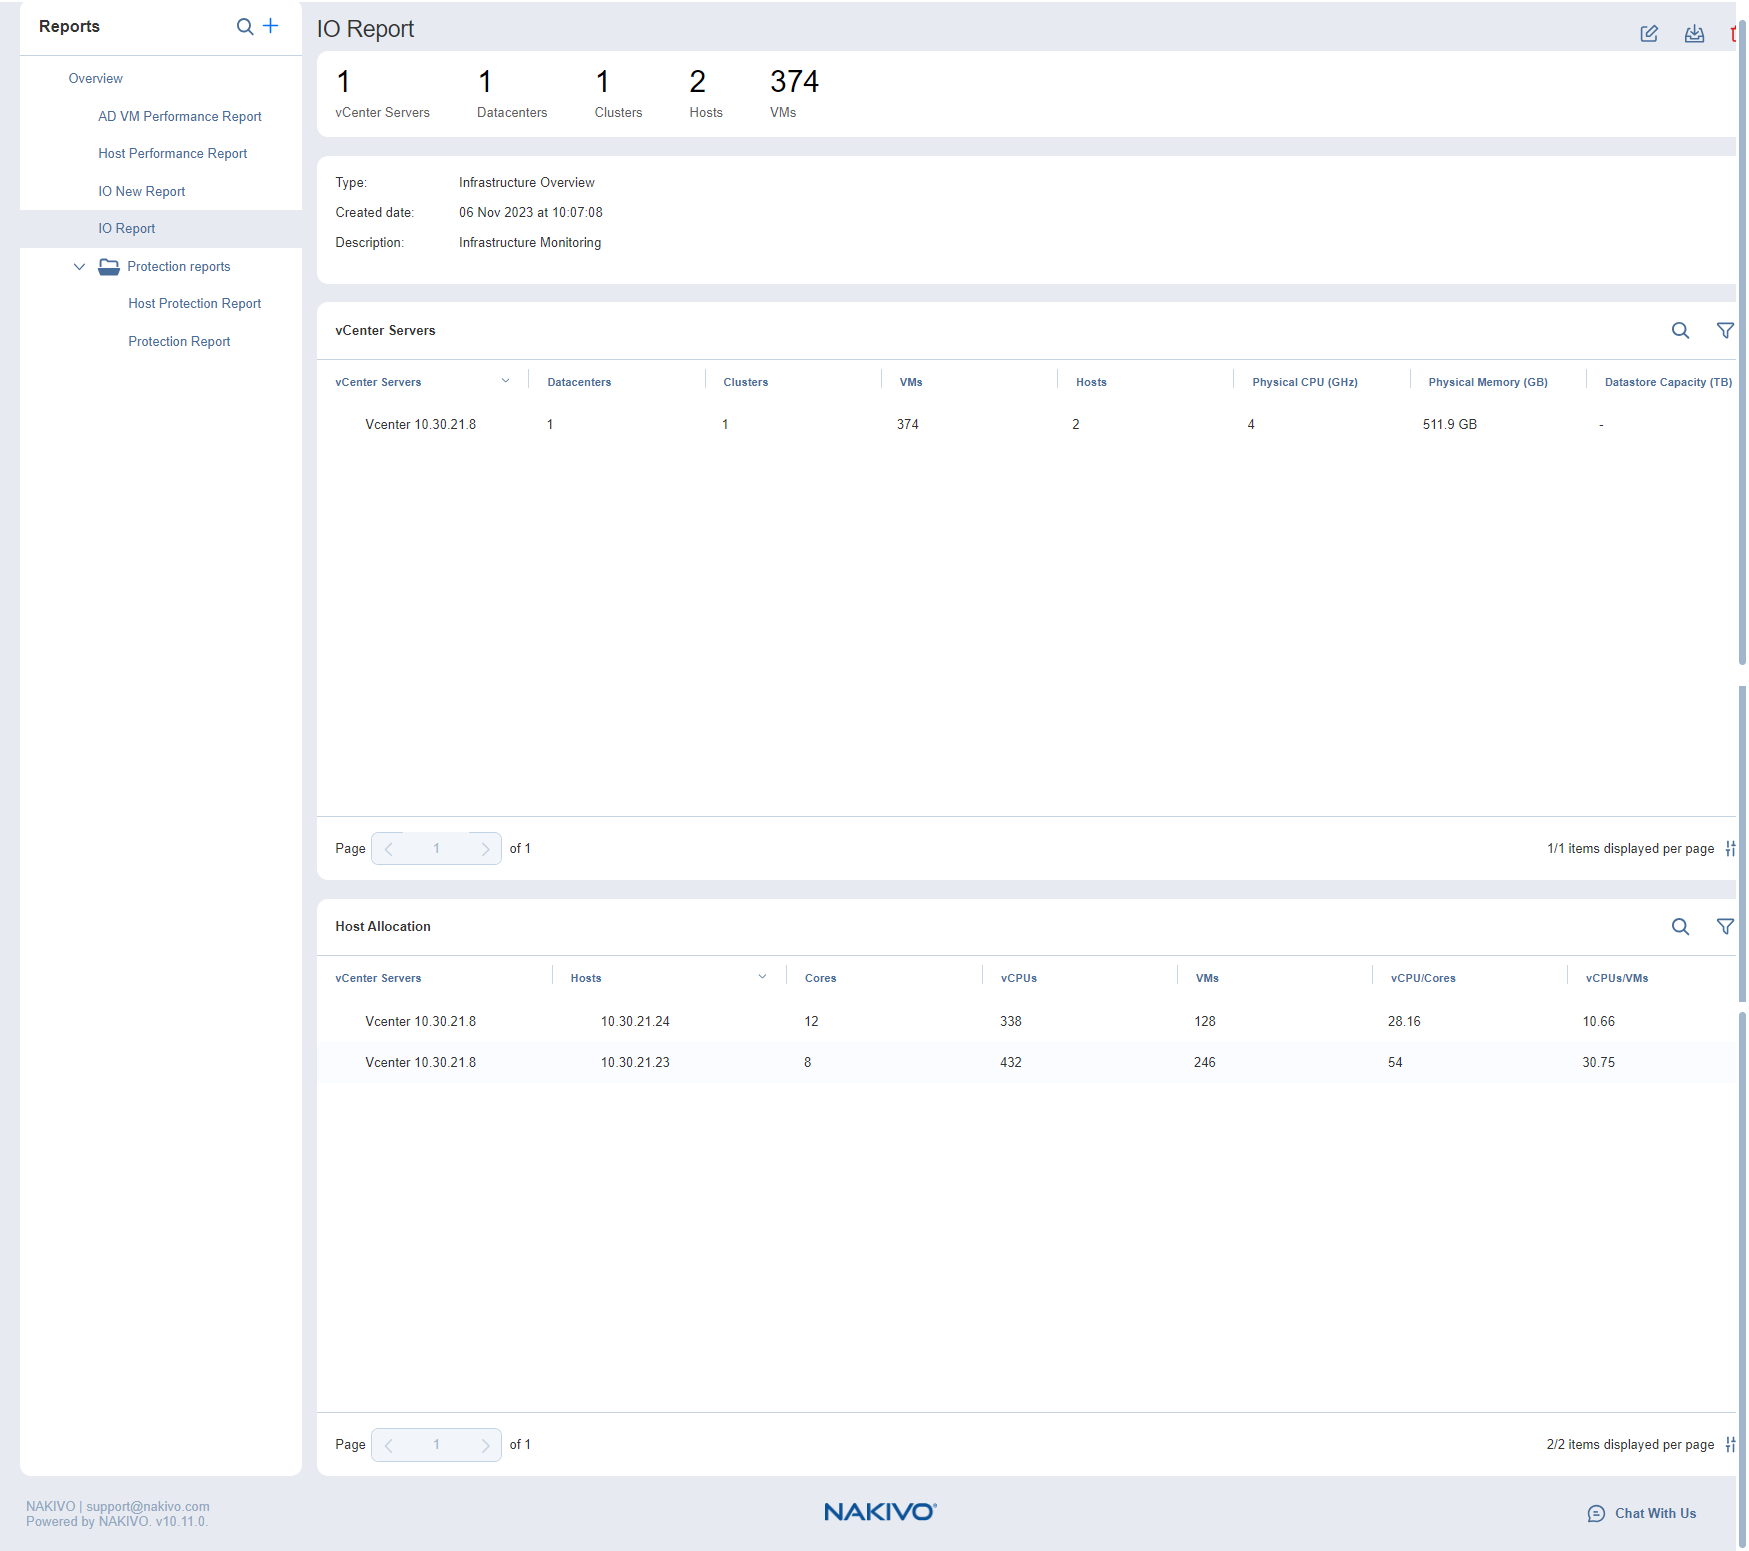
Infrastructure Overview
Displays an overview of selected vCenters, child hosts, and standalone hosts.
-
Summary bar: Displays the total number of infrastructure items including:
-
vCenter Servers
-
Datacenters
-
Clusters
-
Hosts
-
VMs
-
-
Report Settings: Displays the report type, date the report was created, and report description.
-
vCenter Servers table: Displays the name of all selected vCenter Servers and their respective numbers of datacenters, clusters, VMs, and hosts, as well as physical CPU (GHz), physical memory (GB), datastore capacity (TB).
-
Host Allocation table: Displays host allocation details of the selected items. The table displays the following columns:
-
Hosts
-
vCenter Servers
-
Cores
-
vCPUs. Virtual CPUs configured for VMs
-
VMs
-
vCPU/Cores. The number of vCPU divided by the number of Cores
-
vCPUs/VMs. The number of vCPU divided by the number of VMs
-
Notes
If added separately, child hosts and/or standalone hosts will not be displayed in the vCenter Servers table.
The Host Allocation table will display - (hyphen) for child hosts and/or standalone hosts listed in the vCenter Servers column.
Use the search and filter buttons in the top right corner of the table to narrow down the list shown.
Note
Corresponding search results will be displayed for the selected table: for the vCenter Servers table, search will return the vCenter servers list while search in the Host Allocation table will return hosts list.
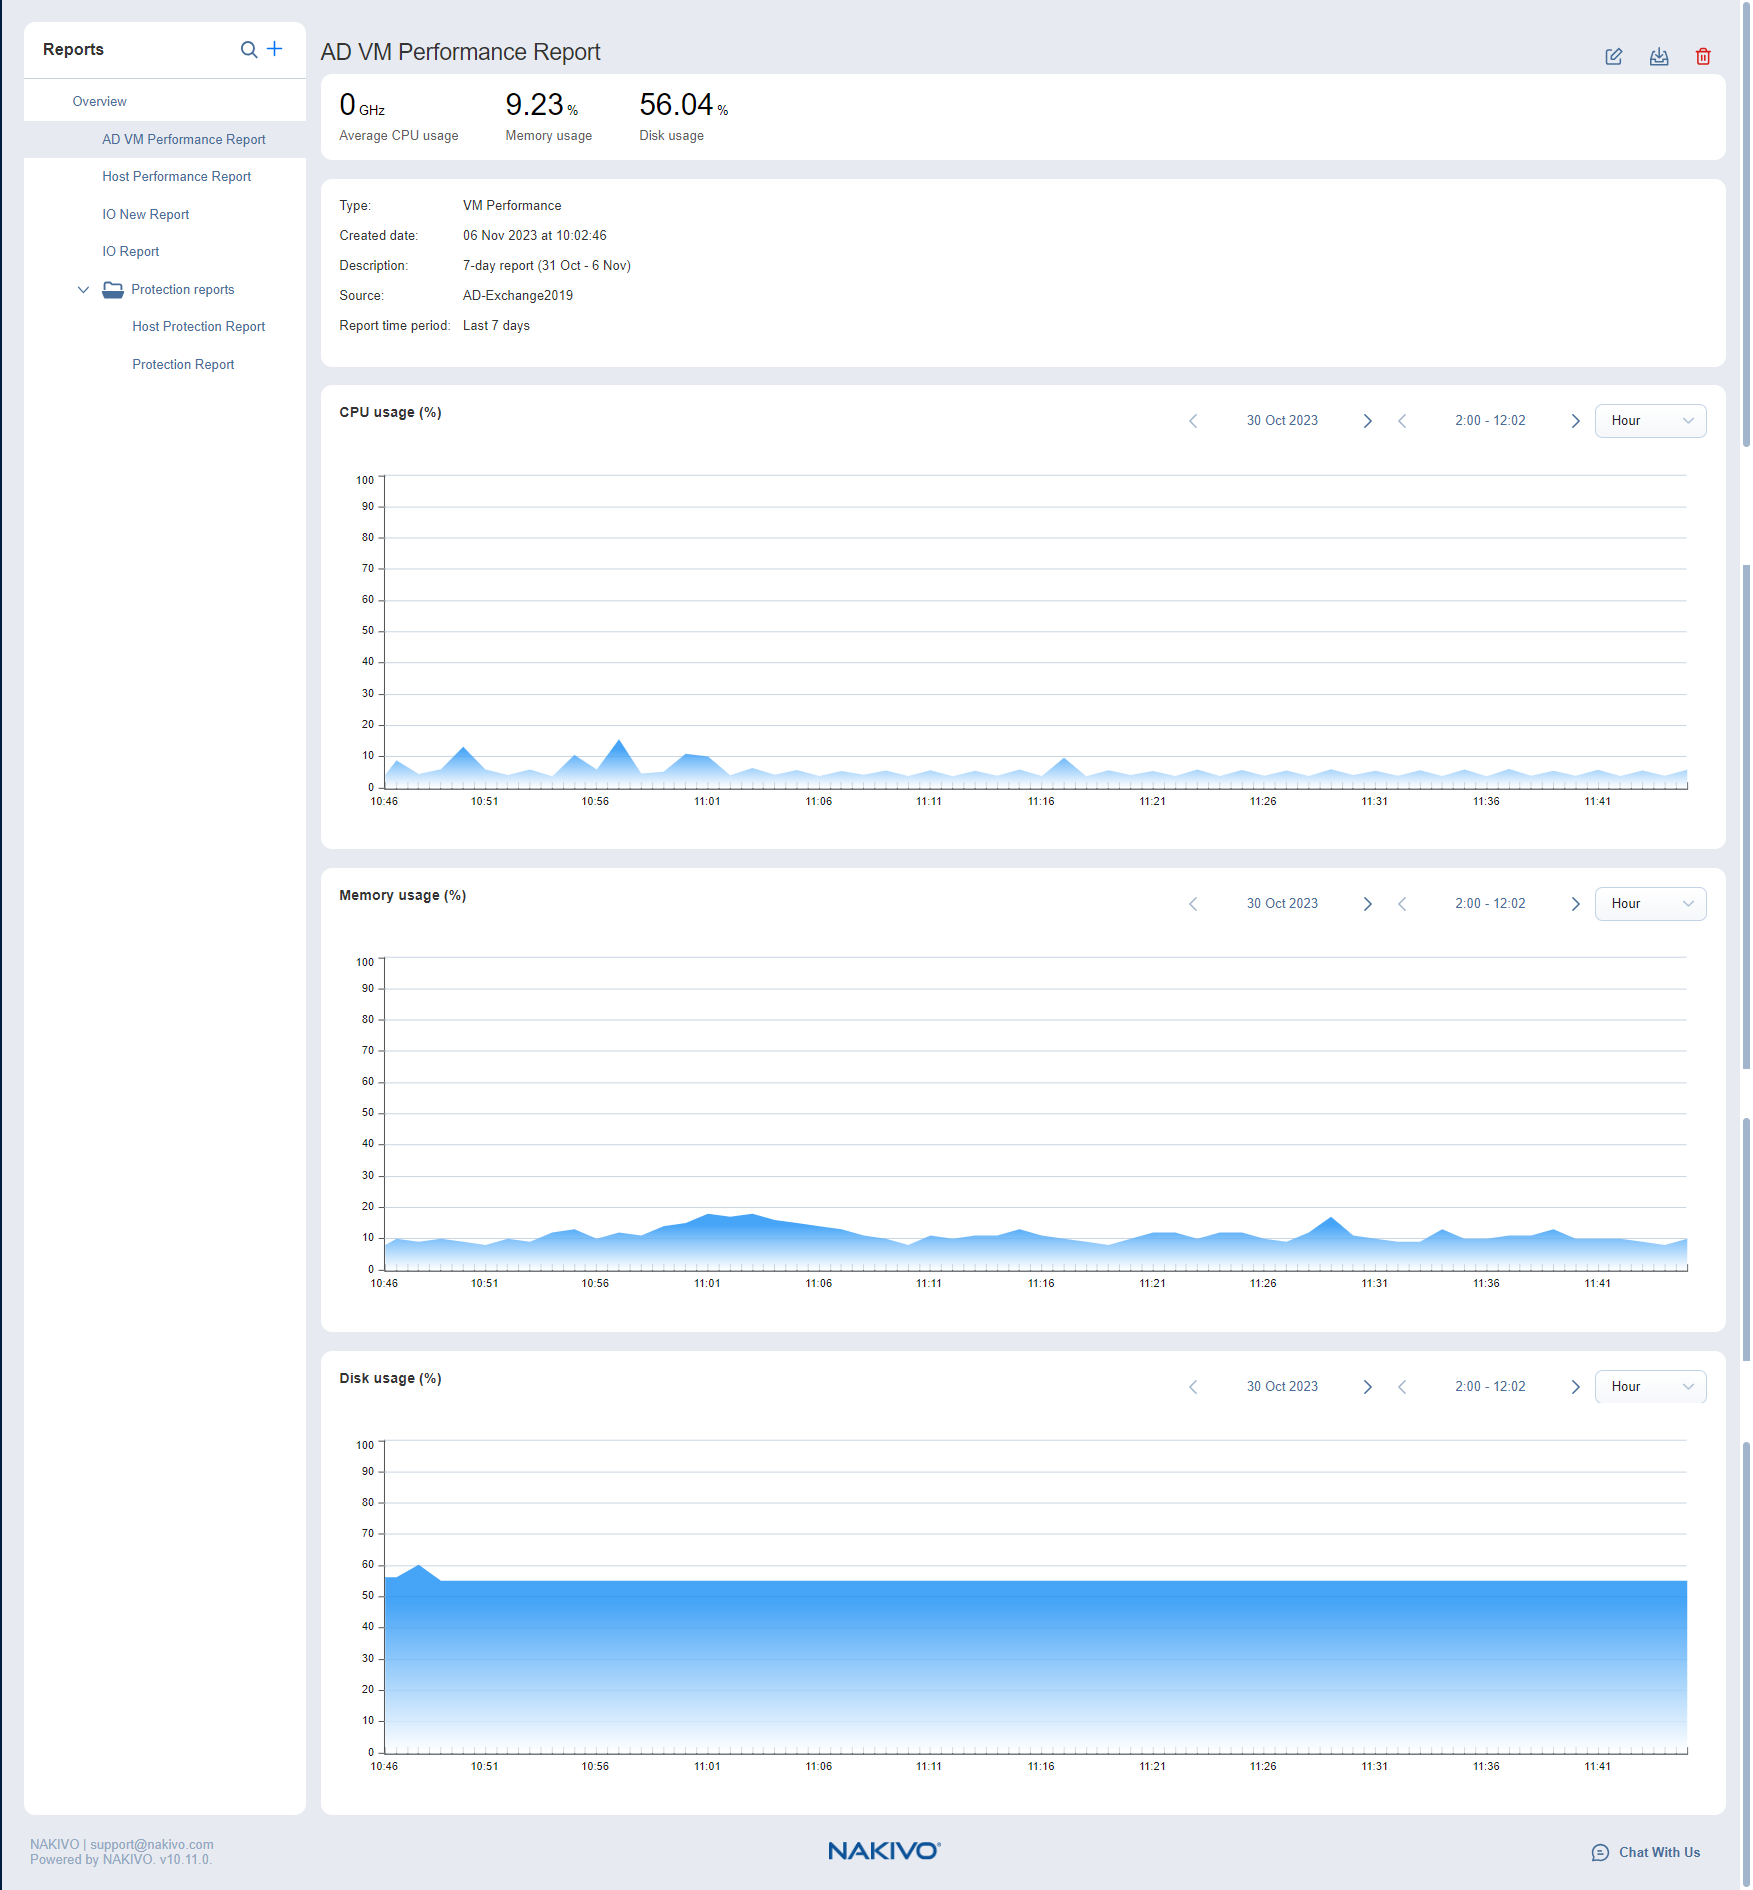
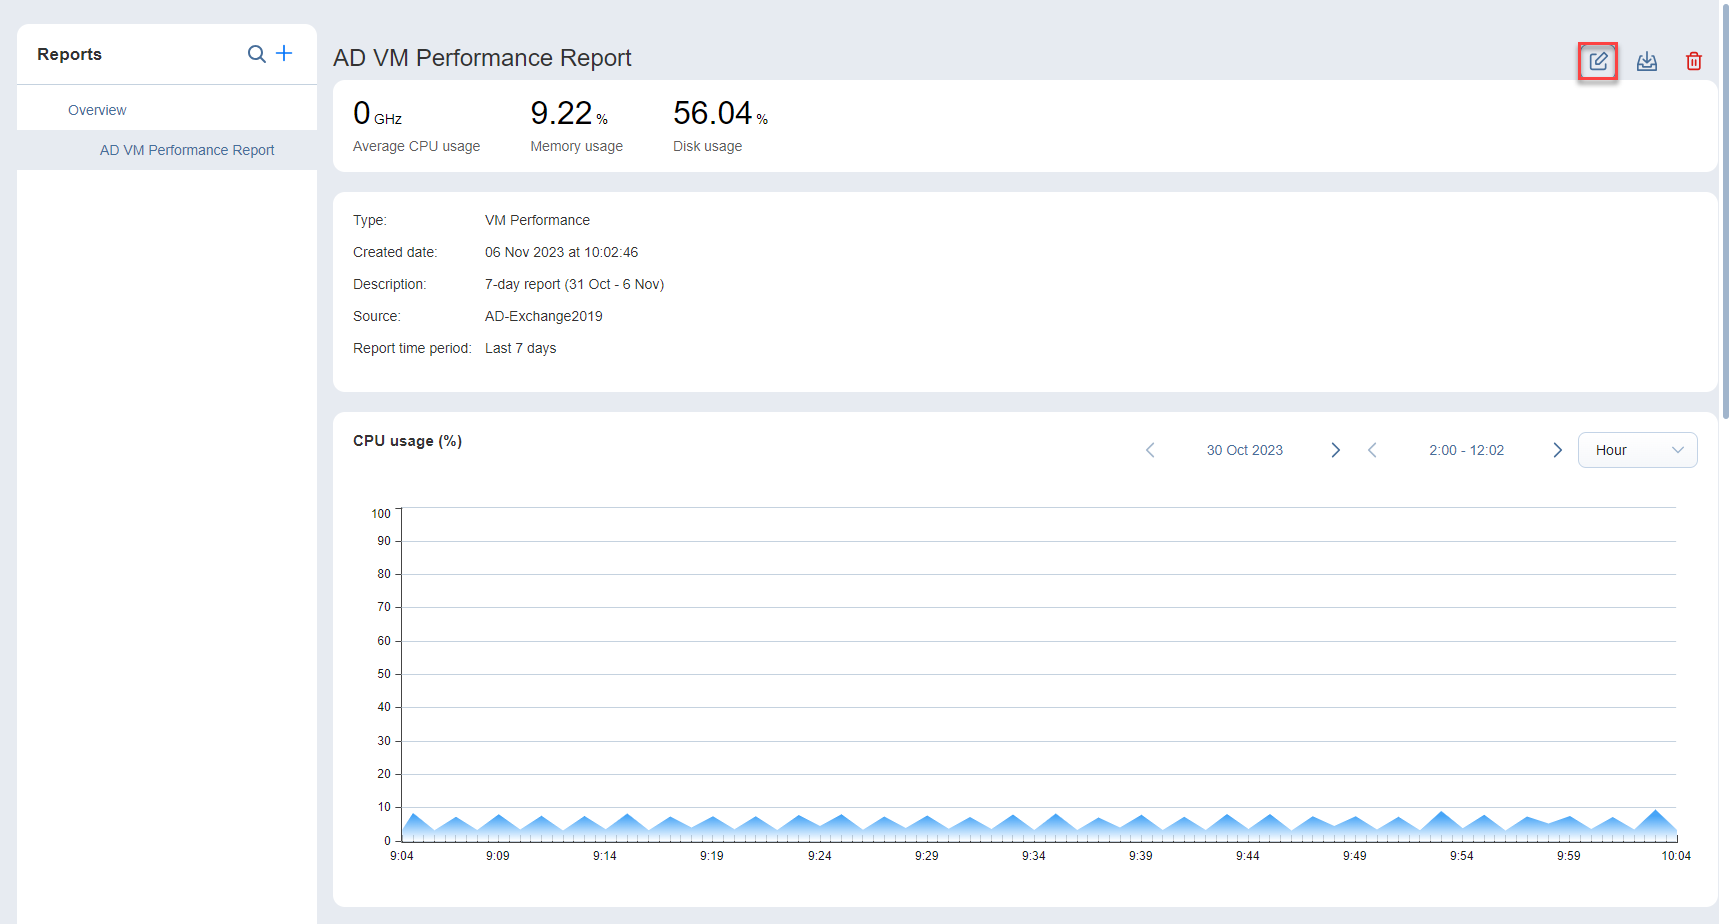
VM Performance
Displays the changes in the average VM CPU usage, memory usage, and disk usage for the items.
-
Summary bar: Displays the following:
-
Average CPU Usage in GHz
-
Memory Usage in %
-
Disk Usage in %
-
Report Settings: Displays the report type, date the report was created, description of the report, source items, and report time period.
-
-
CPU usage (%), Memory usage (%), and Disk usage (%) graphs: Display the average CPU usage, memory usage, and disk usage of selected sources.
Datastore Capacity
Displays information about the capacity of monitored datastores.

-
Summary bar: Displays the following:
-
Number of datastores
-
Total capacity for all datastores in TB
-
Total number of VMs stored on these datastores
-
-
Report Settings: Displays the report type, the date the report was created, and the description of the report.
-
Datastore table: Displays the search and filter buttons and the following columns:
-
Datastore
-
Capacity (GB)
-
Free space (GB)
-
Used space
-
VM count: Displays the number of VMs stored on the datastores.
-
If needed, use the search and filter buttons in the top right corner of the table to narrow down the list shown.
Host Performance
Displays the changes in the average CPU usage and memory usage metrics from the selected sources.

-
Summary bar: Displays the following:
-
Average CPU usage in MHz
-
Memory usage in % unit
-
-
Report Settings: Displays the report type, date the report was created, description of the report, source items, and report time period.
-
CPU usage (MHz) and CPU Usage (%) graphs: Display the average CPU usage of selected sources.
Protection Report
Captures and displays the current (by the time the report is created) state/information of applied NAKIVO Backup & Replication licenses for selected hosts and VMs.

-
Summary bar: Depending on the license type, the summary bar will display the following:
-
A total number of discovered NAKIVO Backup & Replication workloads/sockets
-
A total number of used NAKIVO Backup & Replication workloads/sockets
-
A total number of available workloads/sockets
-
-
Report Settings: Displays the report type, the date when the report was created, and the description of the report.
-
Protected VMs chart: Displays the number of protected (licensed) and unprotected (unlicensed) VMs from selected source items.
-
Host Allocation table: Displays host allocation details of the selected source items. The table displays the following columns:
-
Hosts
-
VMs
-
Licensed: Displays Licensed if a NAKIVO Backup & Replication license is applied to the monitored item for backup jobs.
-
Included in Backup Job(s): Displays Yes if the VMs have been backed up in a backup job.
-
If needed, use the search button in the top right corner of the table to narrow down the list shown.
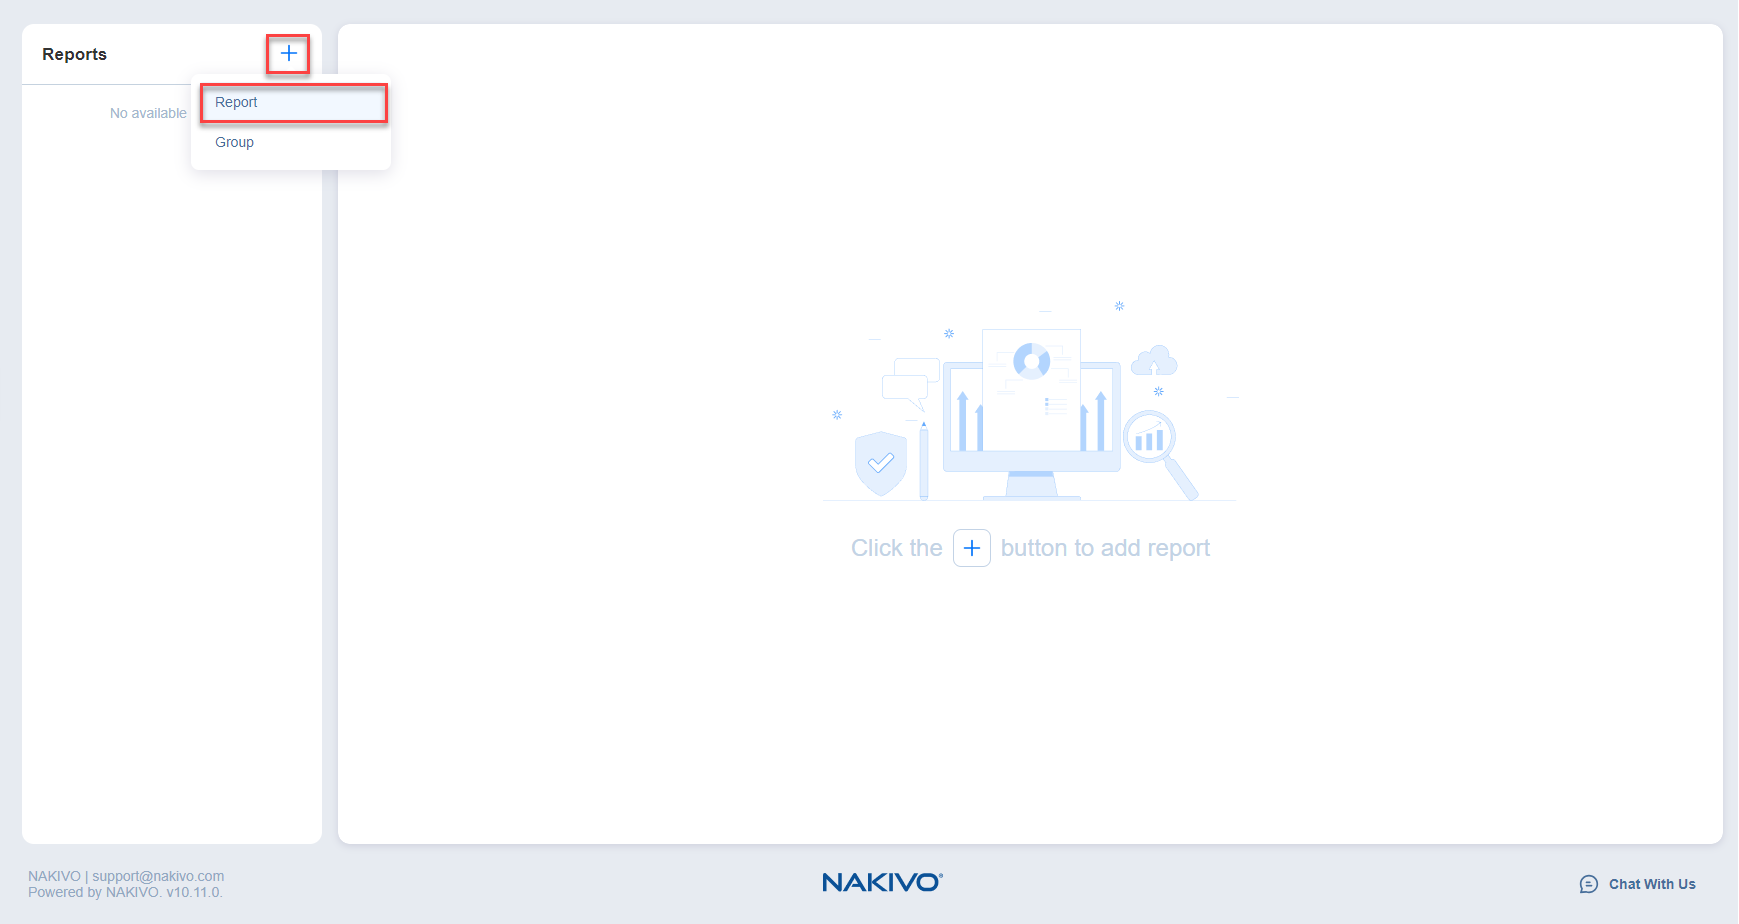
Adding Reports
To create a report:
-
Go to Monitoring > Reports.
-
In the Reports dashboard, click the + (add) button. The Add New Report wizard opens.
Note
You can also select Group to add a report group and then drag the needed report to it in the Reports Overview pane.

Complete the wizard as described in the sections below:
Add New Report Wizard: Source
At the Source step of the wizard, you can….
-
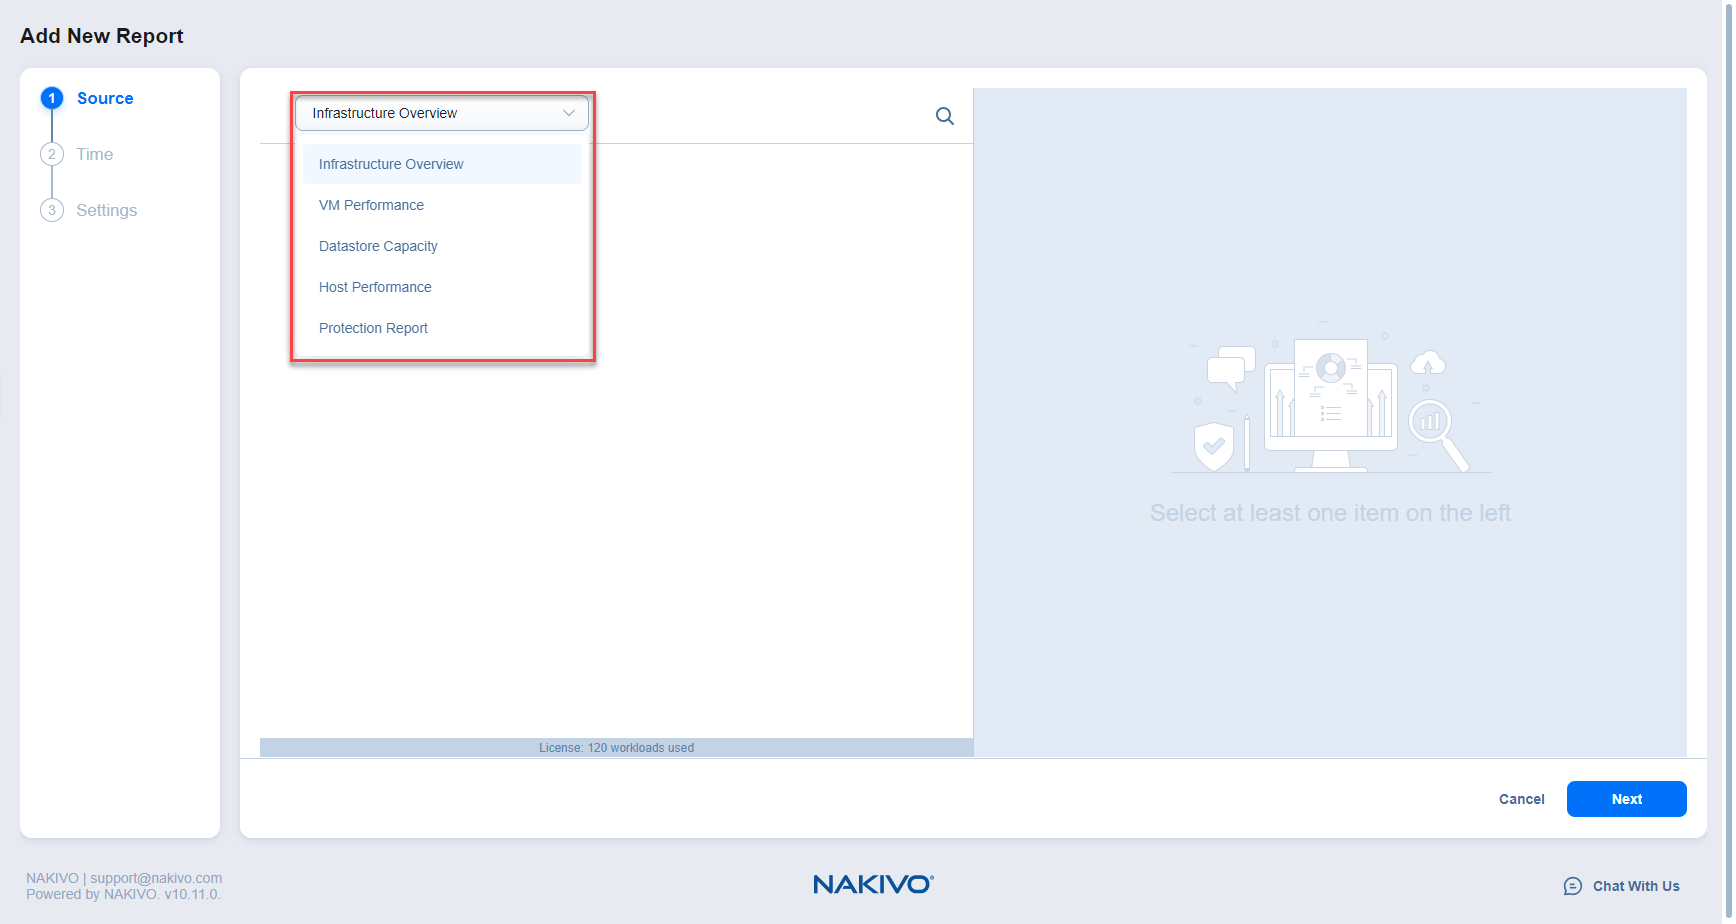
Select the reports type in the drop-down list:
-
Infrastructure Overview: Displays all discovered vCenters, child hosts, and standalone hosts.
-
VM Performance: Displays all VMs with hosts and clusters, which were added to monitoring items.
-
Datastore Capacity: Displays all the datastores that were added to monitoring items.
-
Host Performance: Displays all the hosts that were added to monitoring items.
-
Protection Report: Displays all discovered hosts and all child VMs.
For details, refer to Report Types.

-
-
Select the needed items and then:
-
Click Next to proceed to the next step.
-
Click Cancel to close the wizard.
-
If necessary, click the X button to the right of an item in the right pane to remove it.
Note
You cannot select multiple report types.
If necessary, use the search box to display items based on the selected report.
Create New Report Wizard: Time
At the Time step, you can specify the date range for a report.
Select the time period the report should cover and then click Next. The following options are available:
-
Last 30 days
-
Last 7 days
-
Custom: Select to pick a custom date range

Note
If you select Infrastructure Overview, Datastore Capacity, or Protection Report at the Source step, you can only generate a report for the same day.
Click Cancel to close the wizard or click on a previous step to view or make changes.
Create New Report Wizard: Settings
At the Settings step:
-
In the General section: Provide a name and description (optional) of the report.
-
In the Notifications section: Select the Send report to checkbox and enter the email recipient(s) you want to send the report to. For an email address to be saved for the report, press Enter to turn the entered email address into a tag.
-
Click Finish to create the report. The configured report will be added to the Reports table and the report will be sent to the specified email recipients if the option was selected.
Note
You cannot enter more than 100 email addresses.
Click Cancel to close the wizard or click on a previous step to view or edit it.

Editing Reports
To edit a report:
-
Go to Monitoring > Reports and click Overview.
-
In the All Reports table, select a report, click the ... (ellipsis) button, and then select Edit in the dropdown list. Alternatively, select a report in the left panel and click the Edit icon in the top right of the panel. The Edit Report wizard opens.
-
Follow the procedure described in Adding Reports.

Note
The Item types in the dropdown list of the Source tab cannot be modified in the Edit Report wizard.
Exporting Reports
Note
The report content will vary depending on the report type and configurations defined in the Add New Report wizard or Edit Report wizard.
To export a report:
-
Go to Monitoring > Reports and click Overview.
-
In the All Reports table, select a report, click the ... (ellipsis) button, and then select Export in the dropdown list. Alternatively, select a report in the left panel and click the Export icon in the top right of the panel. The Export Report wizard opens.
-
Select the format: PDF or CSV, and click Export.

Note
Host Performance and VM Performance reports can be exported to the PDF format only.